
FIG 3.
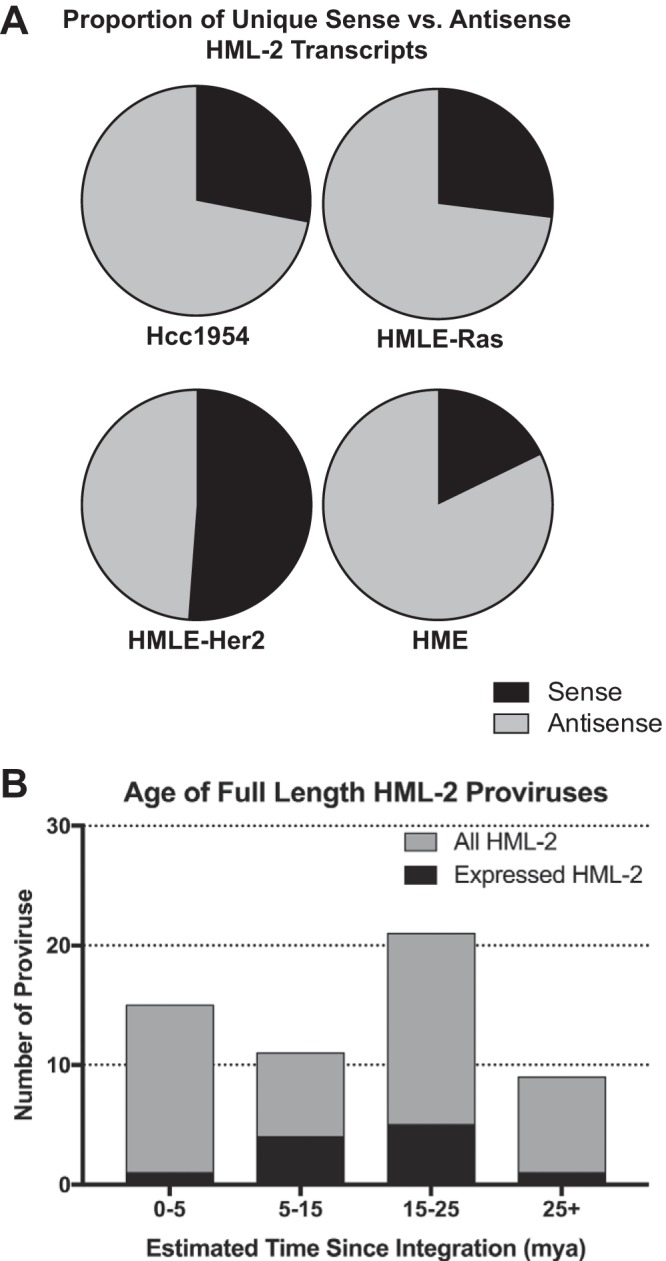
HML-2 expression is dominated by older proviruses producing antisense transcripts. (A) Pie charts comparing the percentage of total HML-2 expression that is due to sense (black) versus antisense (gray) transcription for each cell line sequenced. Sense was determined by the strandedness of the alignment. (B) Bar graph showing the ages, given as estimated time since integration in million years ago (mya), of full-length HML-2 proviruses. The total number of HML-2 proviruses within a given age range is shown in gray. Superimposed, in black, is the number of HML-2 proviruses with significant expression in this study. Age estimates are plotted as averages as determined by Subramanian et al. (4), and any proviruses with indeterminable ages were excluded.