
FIG 4.
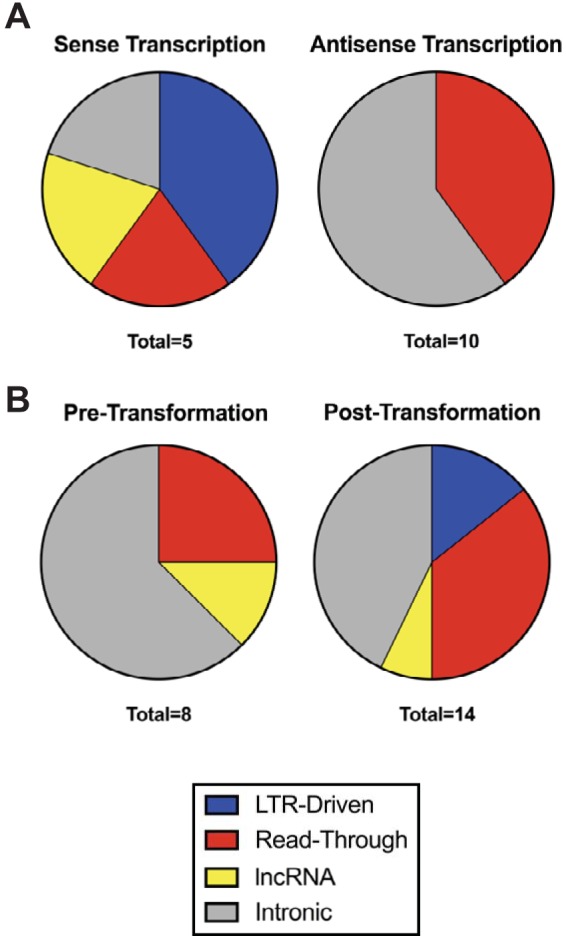
LTR-driven sense transcription is restricted to transformed cells. Pie charts showing the proportion of each mode of transcription identified through IGV to produce sense (left) and antisense (right) transcripts (A) as well as the proportion of each mode of transcription detected in cell lines pretransformation (left, includes HME cell line) and posttransformation (right, includes HMLE-Ras, HMLE-Her2, and Hcc1954 cell lines) (B). “Total” refers to the number of expressed proviruses in each group.