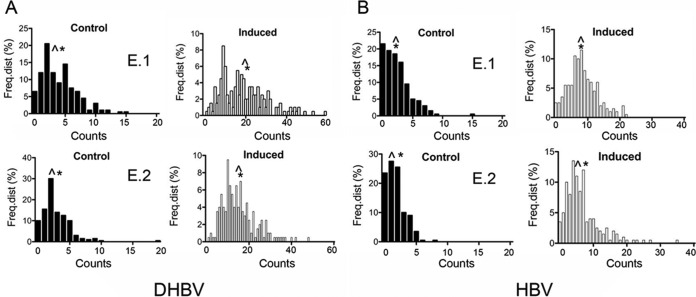
FIG 2.
Nuclear DNA distribution of DHBV cccDNA and HBV nuclear DNA. The figure shows the frequency distributions (Freq.dist) of FISH counts from two independent experiments (experiment 1 [E.1] and E.2) performed with Dstet5 (A) (DHBV) and HepAD38 (B) (HBV) cells. Dstet5 and HepAD38 cells were maintained in the presence of doxycycline (Control) and without the antibiotic for 7 and 25 to 30 days (Induced), respectively. FISH counts were derived from a total of 200 nuclei. See also Tables 1 and 2 for a summary of results from a total of 4 experiments performed with Dstet5 and HepAD38 cells, respectively. ^, median; *, average (mean).

