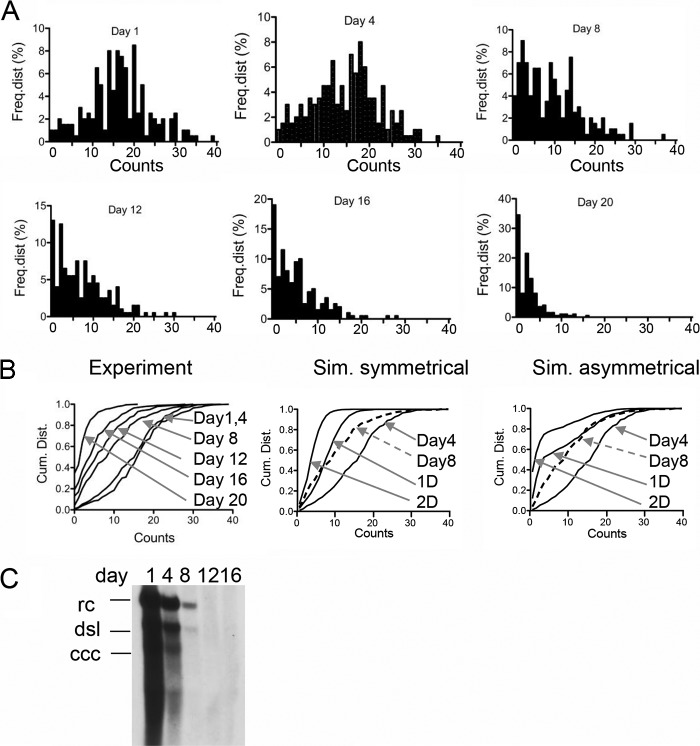
FIG 5.
Dilution of HBV nuclear DNA. The figure shows the frequency distributions of FISH counts obtained from 200 nuclei derived from HepAD38 cells. The design of the experiment is shown in Fig. 4A. FISH analysis was performed at days 1, 4, 8, 12, 16, and 20 following addition of doxycycline (1 μg/ml) and TDF (20 μM) to the medium. Cells were passaged at a dilution of 1:5. (B) Cumulative distribution of the FISH counts shown in panel A (Experiment). The panel also shows simulations (Sim.) of symmetrical and asymmetrical distributions of cccDNA to daughter cells determined as described in the legend to Fig. 4C. (C) Southern blot analysis of HBV Hirt DNA from HepAD38 cells maintained under the conditions described for panel A. rc, relaxed circular DNA (representing PF [protein-free] DNA); dsl, double-stranded linear DNA; ccc, covalently closed circular DNA.

