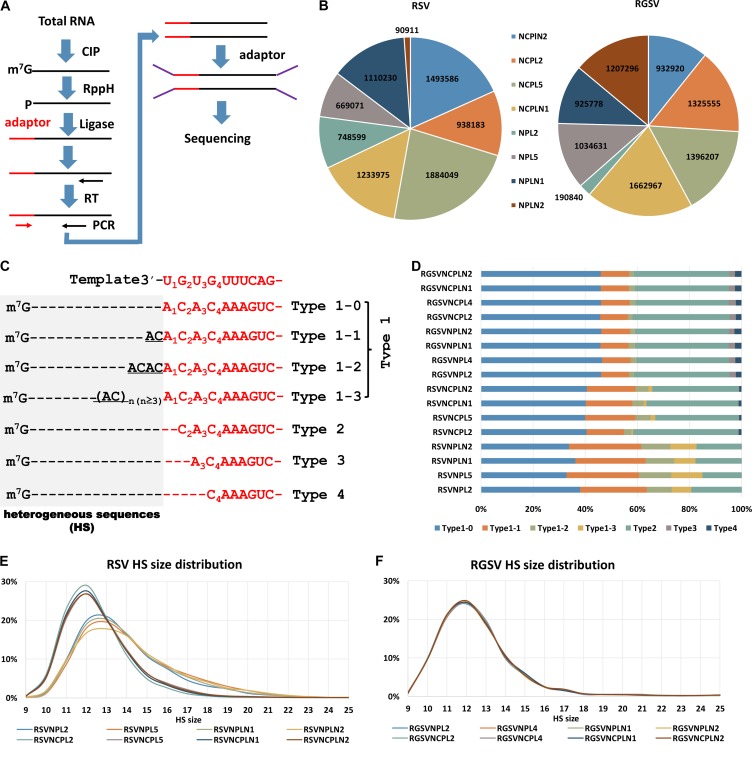
FIG 1.
High-throughput sequencing revealed differences in the occurrence of prime-and-realign events between RSV and RGSV. (A) Diagram showing the experimental procedure for sequencing the 5′ ends of tenuiviral mRNAs. Total RNA extracted from virus-infected rice was treated with alkaline phosphatase (CIP) to remove the 5′-phosphate groups of some RNA species and RppH (NEB) to decap mRNAs and leave a monophosphate at their 5′ ends. An RNA oligonucleotide (red) was added to the 5′-monophosphate-bearing mRNAs, and the oligonucleotide-tagged mRNAs were reverse transcribed and PCR amplified. The PCR products were used for library construction and high-throughput sequencing. (B) The number of reads obtained for NP and NCP mRNAs of RSV and RGSV. For each virus, four samples, named NPL2, NPL5, NPLN1, and NPLN2 were used. NP/NCP mRNAs from the same sample were sequenced independently, resulting in 16 data sets in total, with 8 for each virus. (C) Diagram showing the classification of the viral mRNA sequences. The top row shows the conserved 3′ termini of tenuiviral template RNAs (red). NP or NCP mRNAs whose templated sequences (red) lacked residues corresponding to U1, U1G2, and U1G2U3 of the viral template were called type 2, 3, and 4 sequences, respectively, and the remaining sequences (type 1) were classified into type 1-1, 1-2, 1-3, and 1-4 sequences based on the number of AC repeats at the 3′ end of the nonviral HSs (gray). Dotted lines were introduced to align the sequences. (D) Stacked graph showing the percentages of each type of HS in each data set. (E and F) Size distributions of the HSs extracted from each data set for RSV (E) and RGSV (F). The y axis shows the percentage of HSs with a particular size between 9 and 25 nt.

