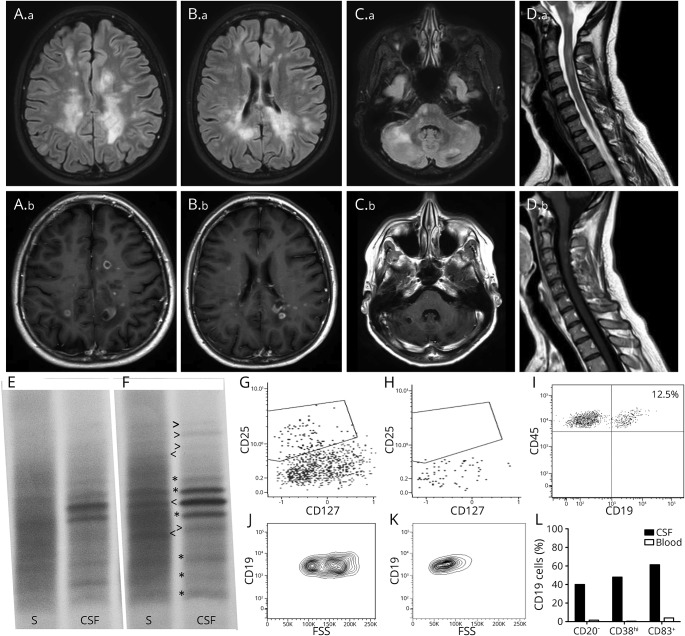
Figure. MRI and immunologic findings.
Brain (A.a–C.a = fluid-attenuated inversion recovery sequences, A.b–C.b = postcontrast T1 sequences) and cervical spinal cord (D.a = T2-weighted sequences, D.b = postcontrast T1 sequences) MRI imaging disclosed several active white matter lesions, many with ring-enhanced morphology. (E, F) IgG isoelectric focusing of paired serum (S) and CSF samples. Compared with the bands detected in August 2016 (E and * in F), during the episode of CNS inflammation following the first alemtuzumab course (February 2017, F), new serum- (<) or CSF- (>) restricted IgG oligoclonal bands were identified. Of interest, a CSF-restricted IgG band detected in August 2016 was found to be mirrored by a serum band in February 2017. (G, H) Analysis of T-helper (CD45+CD3+CD4+) cell subsets in the peripheral blood disclosed an almost complete suppression of TFR (CXCR5+PD1+CD25+CD127dim) lymphocytes in the presence of detectable TFH (CXCR5+PD1+CD25−CD127+), Treg (CXCR5−CD25+CD127dim), and T-helper (CXCR5−CD25−CD127+) cells. (I) Plot shows the proportion of CSF B cells (CD45+CD19+,12.5%) over the total CD45+ leukocyte population (almost all constituted by lymphocytes). (J, K) CSF B cells (J) showed higher values on physical parameters compared with peripheral B cells (K), suggesting an activated status. (L) Compared with peripheral B cells, CSF B cells displayed significant differences in the expression of CD20, CD38, and CD83, suggesting a plasmablast/plasmacells phenotype.

