
Figure 3. Voltage‐activated SR Ca2+ release in WT and KI‐Dnm2 R465 fibres.
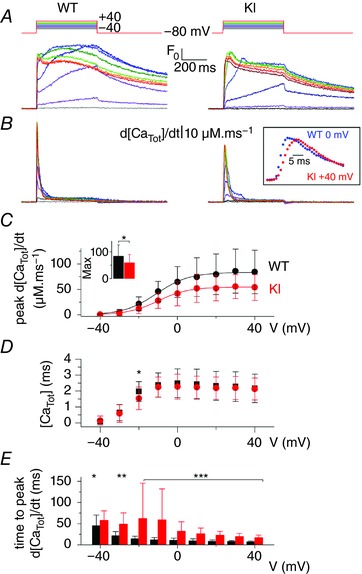
A, representative rhod‐2 Ca2+ transients in a WT and in a KI fibre in response to 0.5 s long depolarizing pulses from −80 mV to the range of indicated values, by 10 mV steps. B, corresponding Ca2+ release flux (d[CaTot]/dt) traces calculated as described in the Methods. C, mean voltage‐dependence of the peak rate of SR Ca2+ release in WT and KI fibres. Superimposed continuous lines show the result from fitting the mean WT and KI data points with a Boltzmann equation. The inset shows the mean values for maximal rate of SR Ca2+ release in the two groups of fibres, as assessed from Boltzmann fits to data from each fibre. D, mean values for the total amount of released Ca2+ calculated from the time integral of the Ca2+ release traces, in WT and KI fibres. E, mean values for the time to peak Ca2+ release in WT and KI fibres.