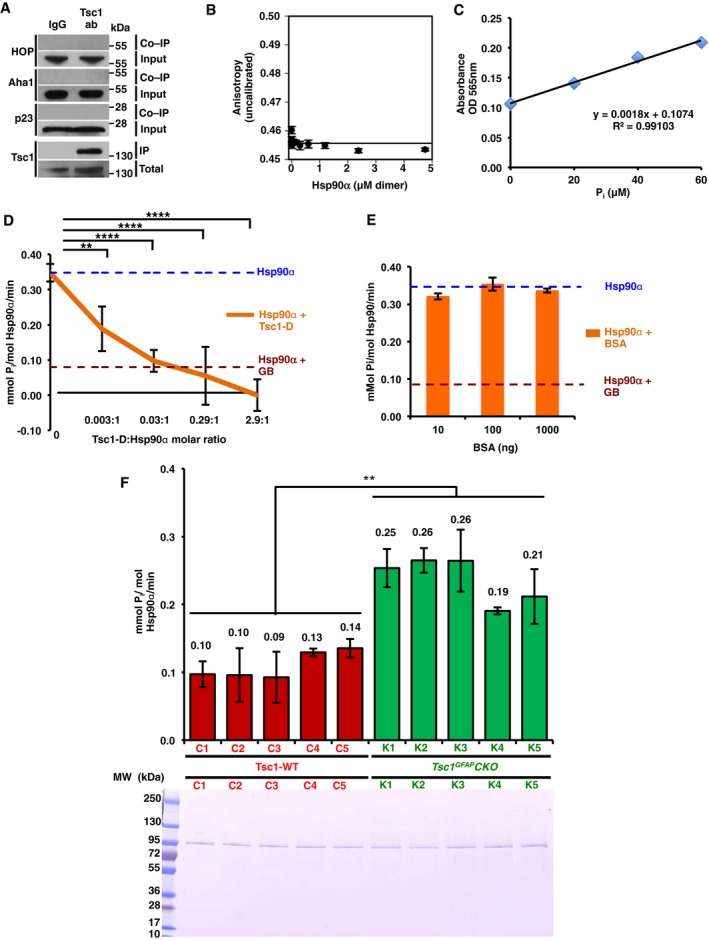
Figure EV2. Inhibition of the Hsp90 function by the co‐chaperone Tsc1 (related to Fig 2).

- Tsc1 was immunoprecipitated from HEK293 cell lysates using anti‐Tsc1 antibody and immunoblotted with indicated antibodies. IgG was used as control. These samples are the same as those presented in Fig 2A.
- BSA binding affinity to bacterially expressed and purified Hsp90α was determined by fluorescence anisotropy. The error bars represent mean ± SD of three independent experiments.
- Inorganic phosphate (Pi) standard curve. The x‐axis shows μM of Pi per assay and the y‐axis shows absorbance at 565 nm. Mean ± SD from values obtained in three independent experiments.
- ATPase activity of Hsp90α in vitro. Inhibitory effects of purified Tsc1‐D‐His6 on the ATPase activity of Hsp90α are shown. All the data represent mean ± SD of three biological replicates. A Student's t‐test was performed to assess statistical significance (**P < 0.005, ****P < 0.0001).
- Different amounts of BSA have no effect on Hsp90 ATPase activity in vitro. All the data represent mean ± SD of three biological replicates.
- ATPase activity of Hsp90 from five Tsc1 GFAPCKO (K1–K5) mice with conditional inactivation of the TSC1 gene in glia and five Tsc1 flox/+‐GFAP‐Cre and Tsc1 flox/flox littermate controls (C1–C5). All the data represent mean ± SD of three biological replicates. A Student's t‐test was performed to assess statistical significance (**P < 0.005); 50 ng of the isolated Hsp90 was resolved on the SDS–PAGE gel and stained with Coomassie stain.
Source data are available online for this figure.
