Fig. 1.
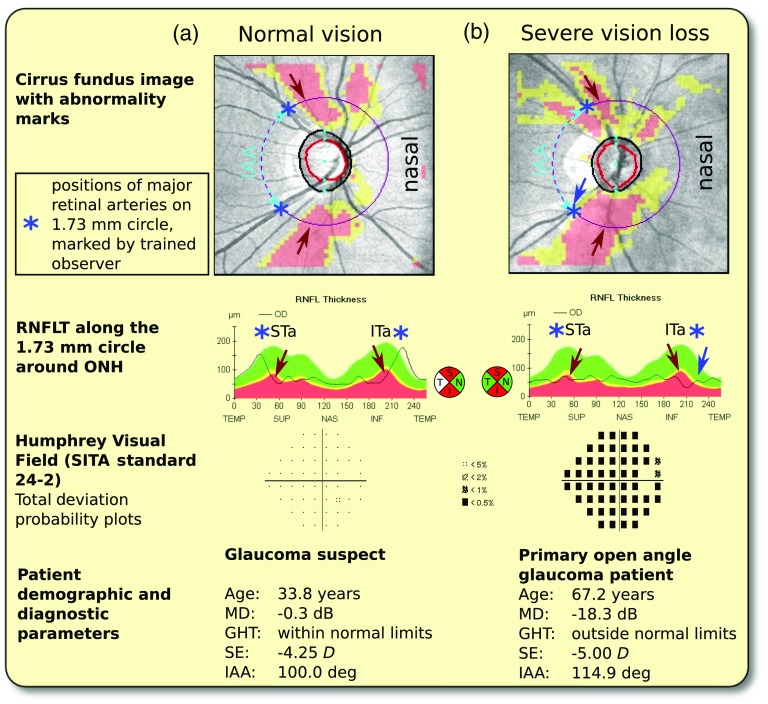
Illustrative RNFLT abnormality patterns of eyes with extreme angles between major STa/ITa (IAA), part 1: patients with small IAA. (a) Glaucoma suspect without VF loss. As illustrated on the plot of RNFLT around the 1.73-mm radius circle (central panel), the patient’s individual RNFLT maxima are in close proximity to the STa/ITa locations (blue asterisks), which is in agreement with previous studies that showed strong correlations between RNFLT maxima and major retinal blood vessels in absence of glaucomatous RNFL thinning. The patient’s individual RNFLT humps, however, are displaced in temporal direction compared to the humps of the Cirrus RNFLT norms (red/yellow/green colored regions), and at the positions of the latter, the naturally thin RNFL of the patient is marked as abnormal (red arrows). (b) Patient with severe vision loss. Large parts of the areas marked as abnormal are at similar locations as for patient A, as denoted by the red arrows. In contrast to patient A, at the patient’s individual ITa/STa locations, RNFLT is severely decreased. However, at the patient’s ITa location, the machine’s normative data expect naturally thin RNFL, so the corresponding region around the blue arrow is not marked as abnormal. MD, VF mean deviation in decibel; GHT, glaucoma hemifield test; SE, spherical equivalent of refractive error in diopters ().

