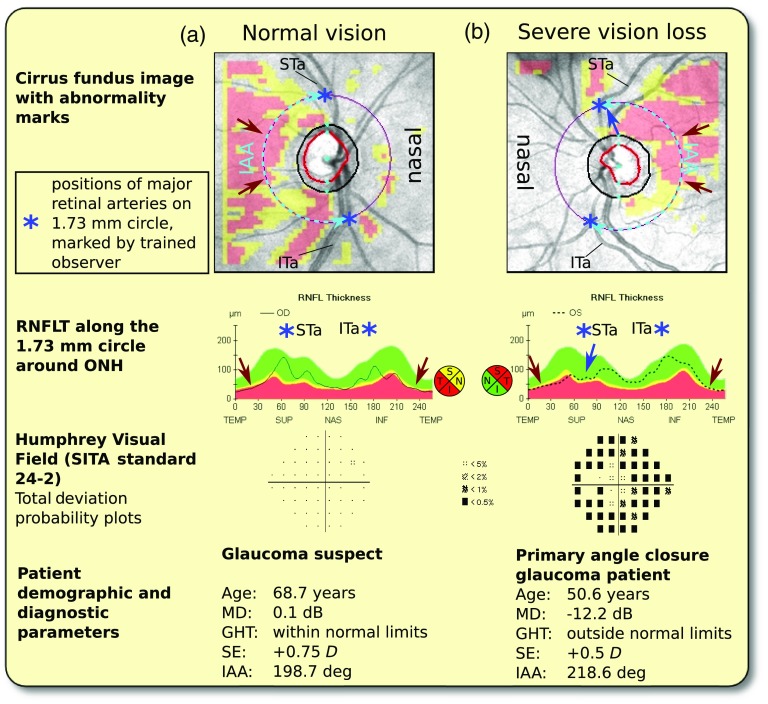
Fig. 2.
Illustrative (RNFLT) abnormality patterns, part 2: patients with large IAA. The results are analogous to Fig. 1, but the patients’ individual RNFLT humps are displaced in nasal direction, so the abnormality is focused on the temporal area (red arrows). As in Fig. 1, for the patient with severe vision loss (b), the region surrounding one of the patient’s individual blood vessel locations (STa) is not marked as abnormal although it is likely that substantial RNFL thinning has occurred (blue arrow). MD, VF mean deviation in decibel; GHT, glaucoma hemifield test; SE, spherical equivalent of refractive error in diopters (D).

