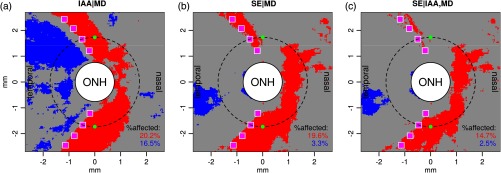
Fig. 5.
Impacts of (a) IAA in addition to VF mean deviation (MD), (b) SE in addition to MD, and (c) SE in addition to IAA and MD on the frequency of abnormality marks. As positional references, the Cirrus standard circle (dashed circle), median superior/inferior temporal artery locations on the four circles (magenta squares), and the two positions shown in Table 5 (green dots) have been added. Red/blue pixels: significant ( after correction for multiple comparisons) increase/decrease of frequency of abnormality marks for decreasing IAA and SE (i.e., higher myopia). Gray areas: not significant. Red/blue numbers in bottom right corner: respective percentage of area in red/blue. The values were obtained from model comparisons by tests with the respective “null model” that contained only MD as regressor, as illustrated and detailed in Table 5 for the two specific positions marked by green dots. In summary, for myopes resp. for patients with small IAA, red pixels denote locations with increased risk of false alarms and blue pixels locations with increased risk of misses. For hyperopes/patients with large IAA, the opposite relationship holds.

