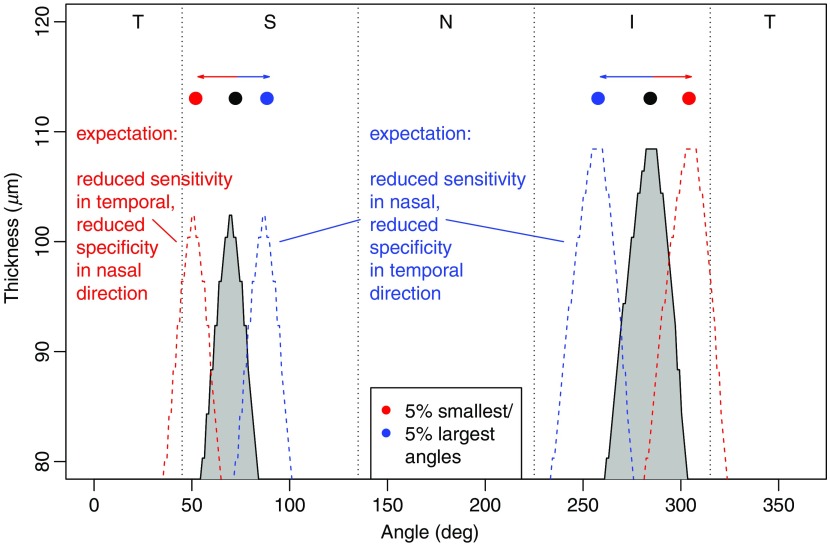
Fig. 7.
Expectations of sensitivity and specificity changes of the Cirrus RNFLT abnormality profiles by artery location, adapted from Fig. 3. Under the assumption that the RNFLTs of a patient follow the norms (gray shaded peaks taken from the gray shaded area in Fig. 3) apart from being spatially shifted according to the patient’s individual artery location, for patients within the 5% smallest artery angles (dashed red curve), reduced sensitivity in temporal and reduced specificity in nasal regions relative to the median artery locations (filled black circles) can be expected. The according expectations for patients within the 5% largest artery angles (blue) are reduced sensitivity in nasal and reduced specificity in temporal directions.

