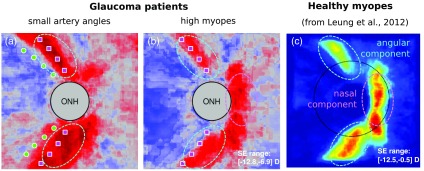
Fig. 8.
Two independent components of specificity loss (i.e., increased risk of false alarms) for myopes. In (a) and (b), angular (cyan) and nasal (magenta) components are graphically superimposed on Fig. 4(b). The same locations were preferably rated as abnormal by the Cirrus machine in a population of 189 healthy myopes in a previous study, as illustrated in (c). The plot of the frequency of abnormality ratings over space in C was reproduced with permission from Fig. 3 in the work of Leung et al.5 In (c), warmer, “more red” colors denote a higher frequency of abnormality marks.

