
Figure 2. Decreased mean power output in humans following recovery at low muscle temperatures.
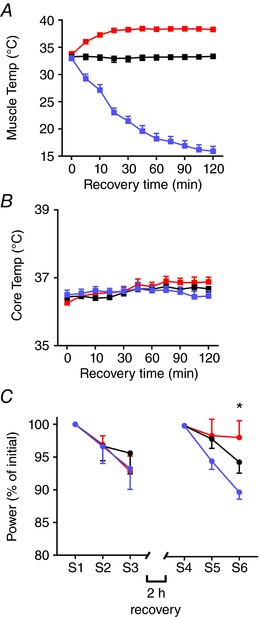
Mean data (± SEM; n = 5) showing changes in lateral triceps brachii intramuscular temperature (A) and body core temperature (B) during the 2 h recovery period, and relative power (C) during the 3 × 5 min fatigue test performed before (S1–S3) and after 2 h recovery (S4–S6). *Main temperature effect (one‐way ANOVA, P = 0.027). Heating (red), control (black), and cooling (blue). [Color figure can be viewed at wileyonlinelibrary.com]