
Figure 3. Recovery of submaximal force is temperature and glucose dependent.
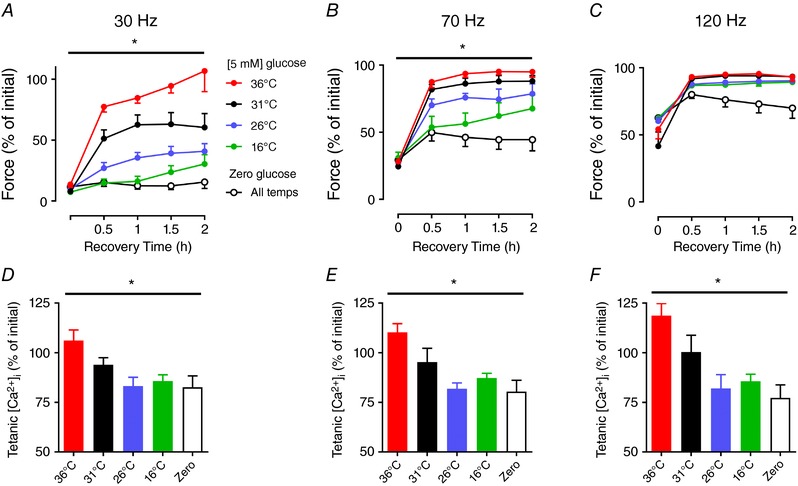
Mean data (± SEM) showing relative force at 30 Hz (A), 70 Hz (B), and 120 Hz (C) during 2 h recovery with glucose (5 mm) at 36°C (red), 31°C (black), 26°C (blue), 16°C (green), and without glucose (open symbols). Tetanic [Ca2+]i at 30 Hz (D), 70 Hz (E), and 120 Hz (F) at 30 min of recovery. Force and [Ca2+]i before the first fatigue test were set to 100% at each frequency. *Two‐way repeated measures ANOVA showed main temperature effect for 30 Hz force (P = 0.0001), 70 Hz force (P = 0.0001), 30 Hz tetanic [Ca2+]i (P = 0.036), 70 Hz tetanic [Ca2+]i (P = 0.006), and 120 Hz tetanic [Ca2+]i (P = 0.002) (n = 4—11 per group). [Color figure can be viewed at wileyonlinelibrary.com]