
Figure 4. Repeated bout fatigue resistance is glucose and temperature dependent.
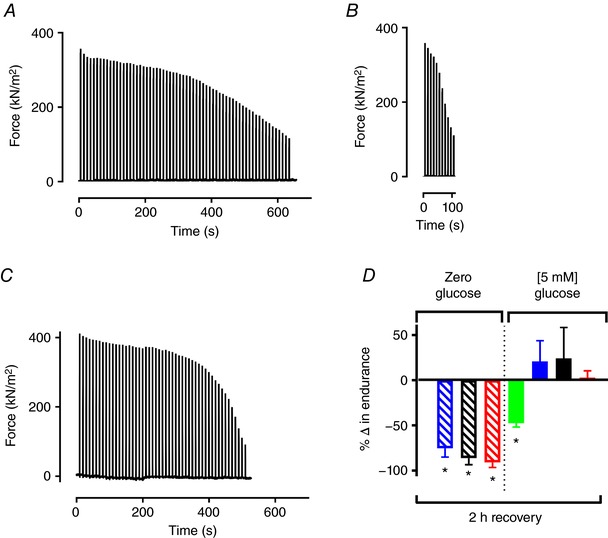
Typical records from a single fibre fatigued with 70 Hz repeated tetani before 2 h recovery (A) and fatigued after 2 h recovery with 120 Hz tetani (B) at 31°C in the absence of glucose. Note the similar starting forces in panels A and B, and the markedly faster fatigue development in panel B. C, typical record from a control experiment with 150 Hz repeated tetani showing that the faster fatigue development in B is not caused by a higher stimulation frequency. D, mean data (± SEM) of relative endurance, expressed as the relative number of contractions performed in the first vs. second fatigue bout for fibres that recovered at 16°C (green), 26°C (blue), 31°C (black), and 36°C (red). *Significantly different from the number of contractions performed in the first fatigue run, (Student's paired t test, P < 0.05, n = 3–5 per group); thick horizontal line at 0% indicates no difference between the first and second fatigue bouts. [Color figure can be viewed at wileyonlinelibrary.com]