
Figure 5. Fatigue resistance is decreased after 1 h recovery at low temperature.
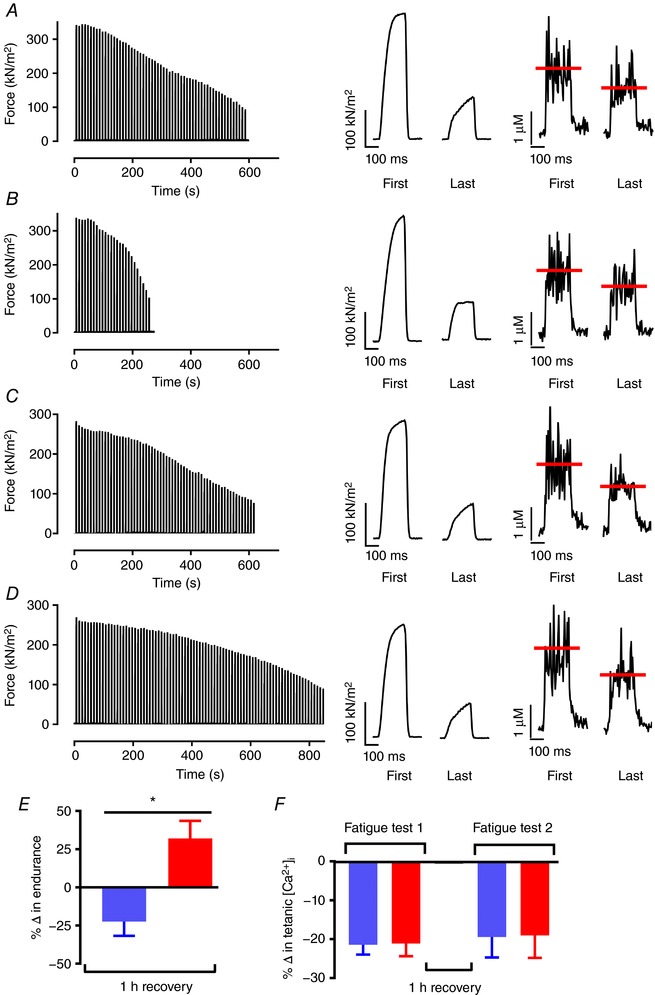
Typical force records from a single fibre during repeated tetanic stimulation performed before (A) and after 1 h of recovery at 26°C (B), and before (C) and after 1 h of recovery at 36°C (D). Right panels show force and [Ca2+]i for the first and last contractions of the fatigue runs. The line (red) indicates the mean tetanic [Ca2+]i during the tetanus. E, mean data (± SEM) comparing relative fibre endurance, which is expressed as the number of contractions performed in the first vs. second fatigue test for fibres that recovered at 26°C (blue), and 36°C (red). *Endurance was significantly different following recovery at 26°C vs. 36°C (Student's unpaired t test, P = 0.0035, n = 6–7). F, mean data (± SEM) of the relative fatigue‐induced decline in tetanic [Ca2+]i during each fatigue test. Thick horizontal line at 0% signifies no change in endurance between the first and second fatigue bouts (E) and no fatigue‐induced change in tetanic [Ca2+]i (F). [Color figure can be viewed at wileyonlinelibrary.com]