
Figure EV1. Average TADs called in many cell types show enrichments in zygote Hi‐C and snHi‐C.
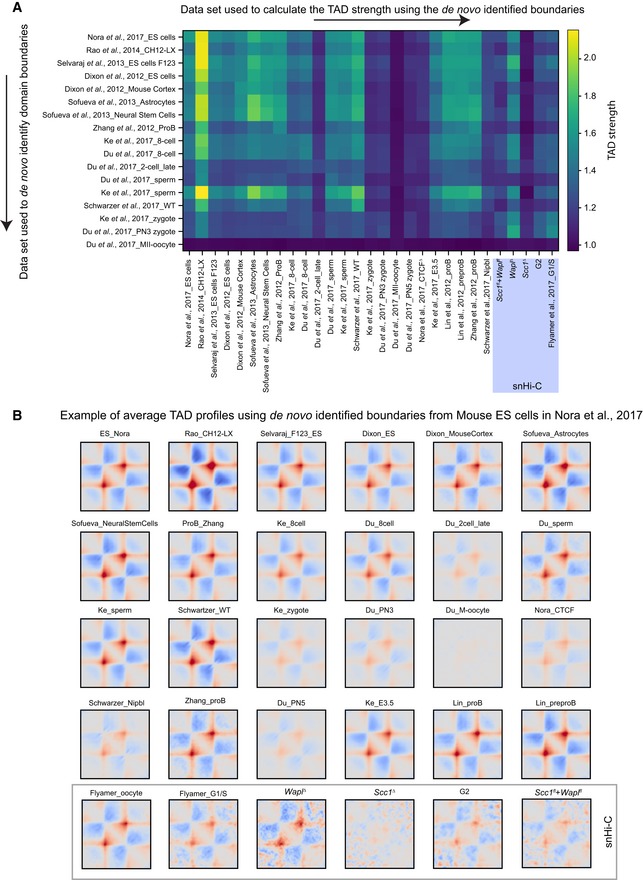
- TAD boundaries were de novo identified in many cell types and Hi‐C data sets using the corner score as described in Schwarzer et al (2017) using the lavaburst software. The de novo identified boundaries were used to generate average TAD profiles (shown in B), and the TAD strength was computed (see Materials and Methods). Notably, all data sets showed enrichments for TADs for all identified boundaries except MII oocytes (Du et al, 2017) which are in mitosis and are not expected to have TADs (Naumova et al, 2013), and our Scc1 ∆ zygotes. All TAD strength analyses for snHi‐C data sets are highlighted (purple box).
Source data are available online for this figure.