
Figure EV3. Additional information on conditional knockouts.
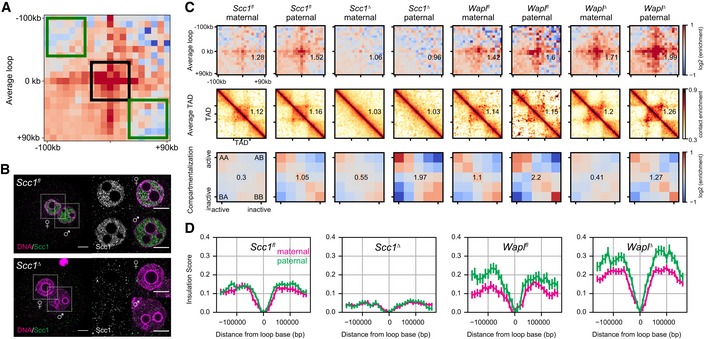
- Loop strengths were calculated using the three 60 × 60 kb square regions shown. The average value within the middle box (black) was divided by the average of the combined top‐left and bottom‐right (green) boxes. The resulting number was subtracted by 1 to indicate the fractional increase in loop strength above the background.
- Immunofluorescence staining of Scc1 in in situ fixed Scc1 fl (n = 11) and Scc1 ∆ zygotes (n = 12, from one experiment using two females of each genotype). DNA in magenta; Scc1 in gray/green. Images were adjusted in brightness/contrast in the individual channels using ImageJ. Scale bars: 10 μm. Left: single z‐slice of zygotes. Right: single z‐slice of the maximum cross‐sectional area of maternal and paternal nuclei. Cropped area is indicated.
- Loops, TADs, and compartment saddle plots for the Scc1 fl, Wapl fl, Scc1 ∆, and WaplΔ conditions are shown separately for the maternal and paternal data. The average strength of each feature is indicated in each panel. Data shown are based on n(Wapl fl, maternal) = 7, n(Wapl fl, paternal) = 6, n(WaplΔ, maternal) = 8, n(WaplΔ, paternal) = 7, n(Scc1 fl, maternal) = 13, n(Scc1 fl, paternal) = 17, n(Scc1 ∆) = 28, and n(Scc1 ∆) = 17 nuclei, from at least two independent experiments using two to three females per genotype each.
- Insulation scores calculated with a sliding diamond of size 40 kb, with the “zero” position denoting a domain boundary identified previously in CH12‐LX cells (Rao et al, 2014). Distances are reported in base pairs from a domain boundary. The average over all domain boundaries is reported; error bars are the standard error on the mean insulation score.
Source data are available online for this figure.