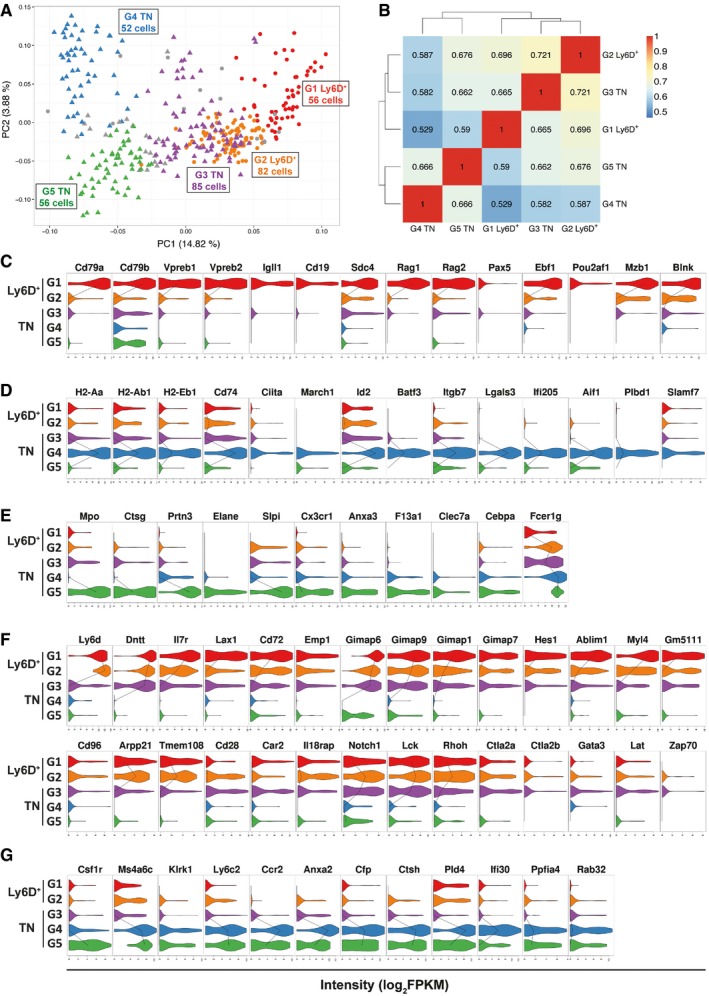
Figure 4. Cell clustering identifies three TN and two Ly6D+ subgroups with distinct genetic signatures.

-
APCA generated as in Fig 3B showing the subgroups revealed by PAM clustering method (see Materials and Methods). Circles: Ly6D+, triangles: TN. G1 Ly6D+ (n = 56), G2 Ly6D+ (n = 82), G3 TN (n = 85), G4 TN (n = 52), G5 TN (n = 56).
-
BHeatmap with pairwise Pearson's transcriptome correlation of Ly6D+ and TN subgroups. The number of cells (n) per subgroup is specified in (A).
-
C–GViolin plots with genes highly expressed in G1 Ly6D+ (C), G4 TN (D), G5 TN (E), (G1, G2) Ly6D+ and G3 TN (F), or G4 and G5 TN (G) subgroups compared to the other subgroups. The median expression level is shown with a line when more than 50% of the cells express the indicated gene.
