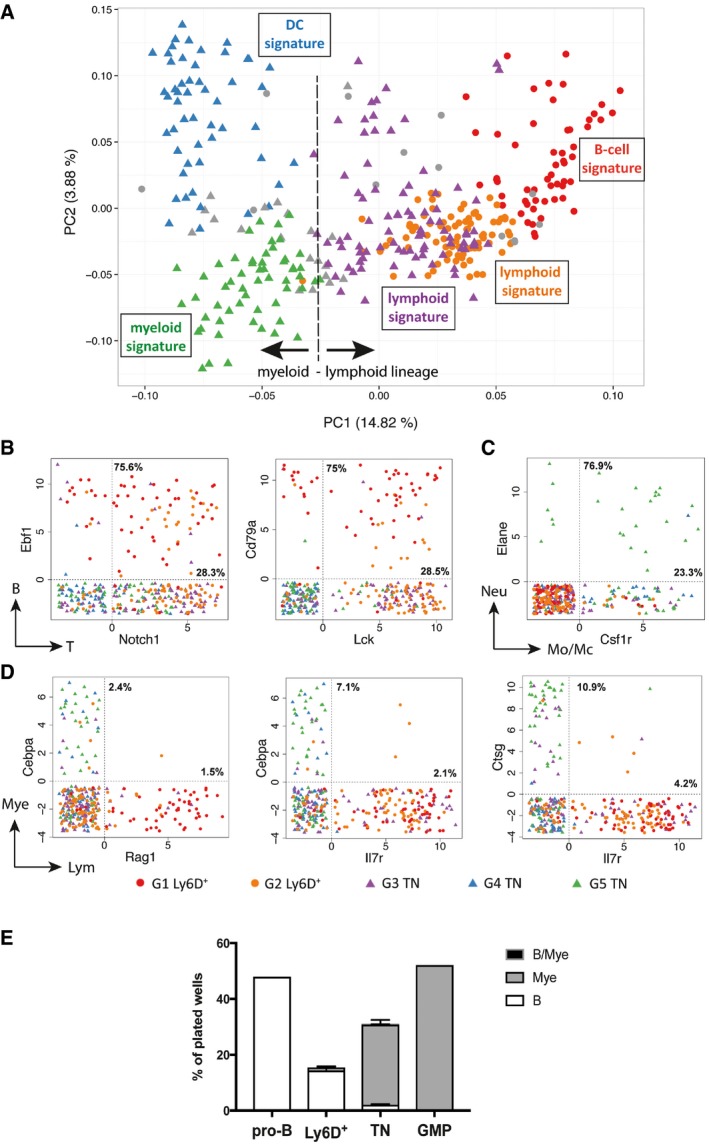
Figure 5. Mixed‐ and opposed‐lineage states at the single‐cell level.

-
ASame PCA plot as in Fig 4A summarizing the genetic signatures of the Ly6D+ and TN subgroups revealed by our in silico analysis.
-
B–DScatter plots showing the expression levels in log2FPKM of selected B and T (B), neutrophil (Neu) and monocyte/macrophages (Mo/Mc) (C) or myeloid (Mye) and lymphoid (Lym) (D) lineage marker pairs in the Ly6D+ and TN subpopulations. Dotted vertical and horizontal lines delimit when the transcript of the indicated gene is detected (> 0). Percentages within the double‐positive area of the plot indicate the fraction of cells co‐expressing both genes to the number of cells expressing only one gene (top: gene on vertical axis; bottom: gene on horizontal axis).
-
EB‐cell, myeloid, and bipotent (B/Mye) developmental potential of the indicated single‐cell sorted populations from Flt3Ltg. Three independent experiments were performed for Ly6D+ and TN cells and one for the control pro‐B and GMP cells. Shown is mean ± SEM.
