
Figure 2. Chromatin organization changes upon auxin‐induced CTCF degradation.
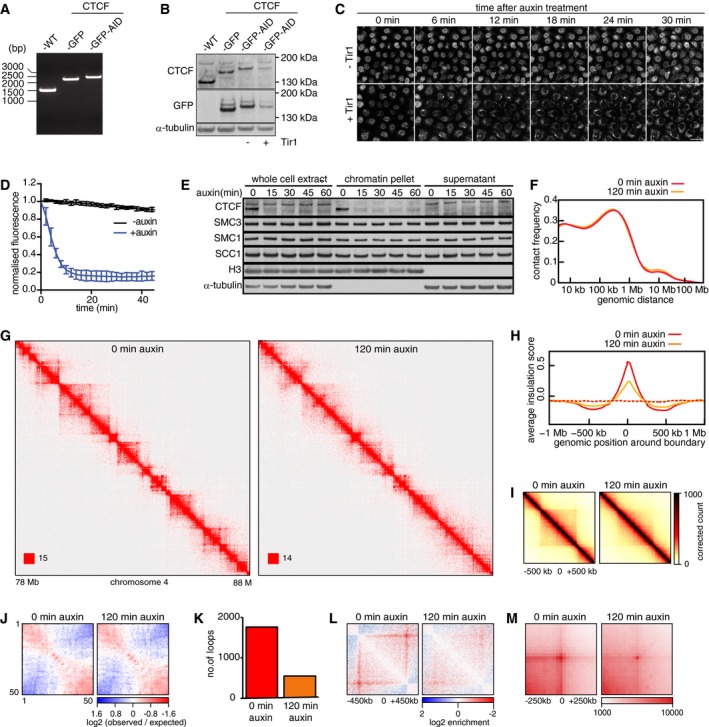
- Genotype analysis of parental HeLa cells (WT), homozygous CTCF‐mEGFP cells (GFP), and homozygous CTCF‐mEGFP‐AID cells (GFP‐AID). Genomic PCR products were generated with the primers that are designed external to the homology arm which was used for inserting mEGFP or mEGFP‐AID encoding sequences downstream of the CTCF gene. This resulted in fusion proteins with mEGFP or mEGFP‐AID tags C‐terminal to the CTCF gene.
- Immunoblotting analysis of whole‐cell extracts from parental HeLa WT cells, CTCF‐mEGFP cells, CTCF‐mEGFP‐AID (−) cells (i.e., not expressing Tir1), and CTCF‐mEGFP‐AID cells expressing Tir1 (+). α‐Tubulin: loading control.
- Time course live‐cell imaging of CTCF‐mEGFP‐AID cells after auxin treatment. CTCF‐mEGFP‐AID cells with (+) or without (−) Tir1 were imaged after addition of auxin. Scale bar indicates 20 μm.
- Quantification of nuclear GFP signal over time after auxin addition to CTCF‐mEGFP‐AID cells with (+) or without (−) Tir1. Normalized nuclear GFP signals are plotted over time after addition of Auxin into −Tir1 and +Tir1 cells (mean ± SD). n = 9 cells per condition.
- Chromatin fractionation and immunoblot analysis of auxin‐treated CTCF‐mEGFP‐AID cells expressing Tir1. At the indicated time points after auxin addition, whole‐cell extracts, the chromatin pellet fraction, and the supernatant fraction were analyzed by immunoblotting, using antibodies against the proteins indicated on the left.
- Intra‐chromosomal contact frequency distribution as a function of genomic distance, 0 (red) and 120 min (yellow) after auxin addition to CTCF‐mEGFP‐AID cells expressing Tir1.
- Coverage‐corrected Hi‐C contact matrices of chromosome 4 (78–88 Mb), 0 (left), and 120 min (right) after auxin addition to CTCF‐mEGFP‐AID cells expressing Tir1. The matrices were plotted using Juicebox.
- Average insulation score around TAD boundaries identified in control‐depleted G1 cells, for samples at 0 (red) and 120 min (yellow) after auxin addition to CTCF‐mEGFP‐AID cells expressing Tir1. Dashed lines show the average insulation score around the +1 Mb shifted boundaries as control.
- Aggregate TAD analysis for CTCF‐mEGFP‐AID cells expressing Tir1, 0 (left) and 120 min (right) after auxin addition. Average coverage‐corrected Hi‐C contact matrices are shown centered around the 166 × 500–550 kb long TADs identified in the control‐depleted HeLa cells.
- Long‐range (> 2 Mb) intra‐chromosomal contact enrichment between bins with varying compartment signal strength from most B‐like (1) to most A‐like (50), in the same conditions as (F).
- Number of loops identified by HiCCUPS, in the same conditions as (F–H).
- Average contact enrichment around loops after auxin addition to CTCF‐mEGFP‐AID cells expressing Tir1, for the 82 × 600 kb long loops identified by HiCCUPS in control‐depleted G1 cells. The matrices are centered (0) around the halfway point of the loop anchor coordinates.
- Total contact counts around loops after auxin addition, for all 750 kb–6 Mb long loops identified by HiCCUPS in G1 control. The vertical and horizontal axes of the matrices were centered around the upstream and the downstream loop anchors, respectively.
Source data are available online for this figure.