
Figure EV4. Insulation decreases upon depletion of WAPL and PDS5 proteins.
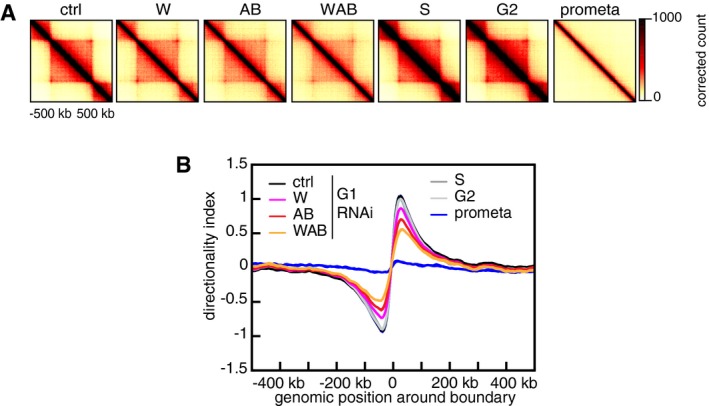
- Aggregate TAD analysis for control‐depleted (ctrl), WAPL‐depleted (W), PDS5A/PDS5B‐depleted (AB), joint WAPL/PDS5A/PDS5B‐depleted (WAB) cells in G1‐phase, as well as S‐phase (S), G2‐phase (G2), and prometaphase (prometa) cells. Average coverage‐corrected Hi‐C contact matrices are shown centered around the 166 × 500–550 kb long TADs identified in the control‐depleted G1 cells.
- Average standardized directionality index profiles in a 1 Mb region centered around TAD boundaries identified in the control‐depleted cells, for the same conditions as in (A). Colors are as in Fig 7B.