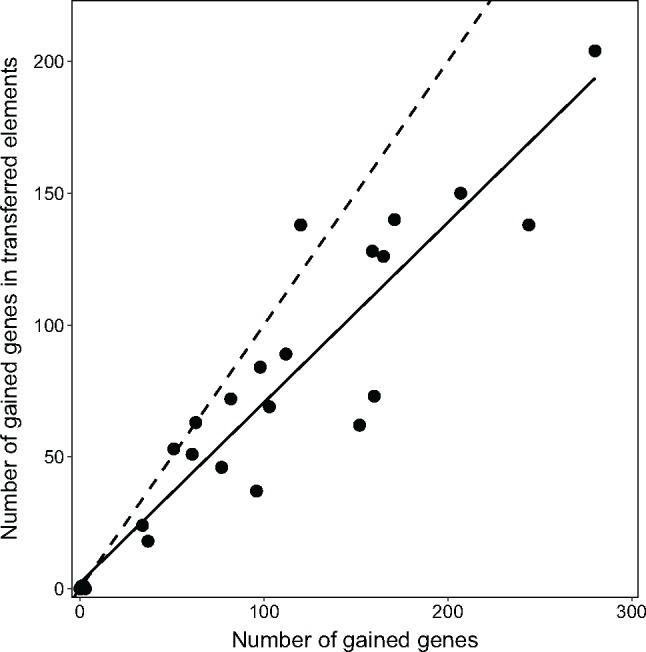
Fig. 2.

—Comparison between the number of gained genes for each Phaeobacter strain (numbers at terminal branches in fig. 1a) and the number of gained genes occurring in predicted horizontally transferred elements. Solid line indicate the calculated linear regression (slope 0.68, pearson correlation r = 0.95, 95%CI(0.89, 0.97), P < 0.001). Dashed line depicts theoretical correlation of r = 1, that is, if all genes were gained by detectable HGT.
