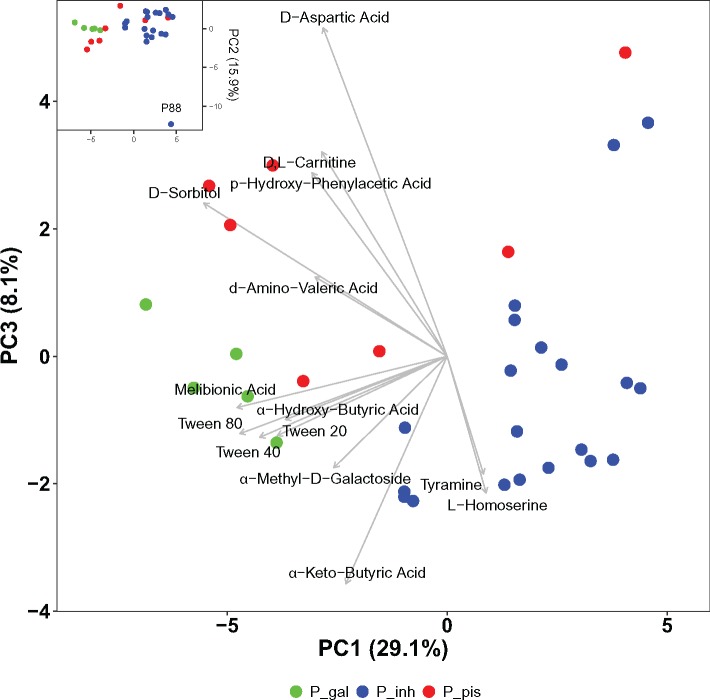
Fig. 5.
—Principal component analysis of the utilization patterns of 190 substrates determined for the 32 Phaeobacter strains on OmniLog PM01 and PM02A plates. Strains were colored according to their phylogenetic lineage (P_gal: P. gallaeciensis, P_inh: P. inhibens, and P_pis: “P. piscinae”). PCA based on two biological replicates for each strain which mean position is shown. Substrates depicted contribute more than average to the ordination of data (Borcard et al. 2011). Results for principal component (PC) 1 and PC 3 are shown. Insert shows analysis for PC1 and PC2; its full scale plot, and an analysis along PC1 and PC4 are shown in supplementary fig. S10, Supplementary Material online).

