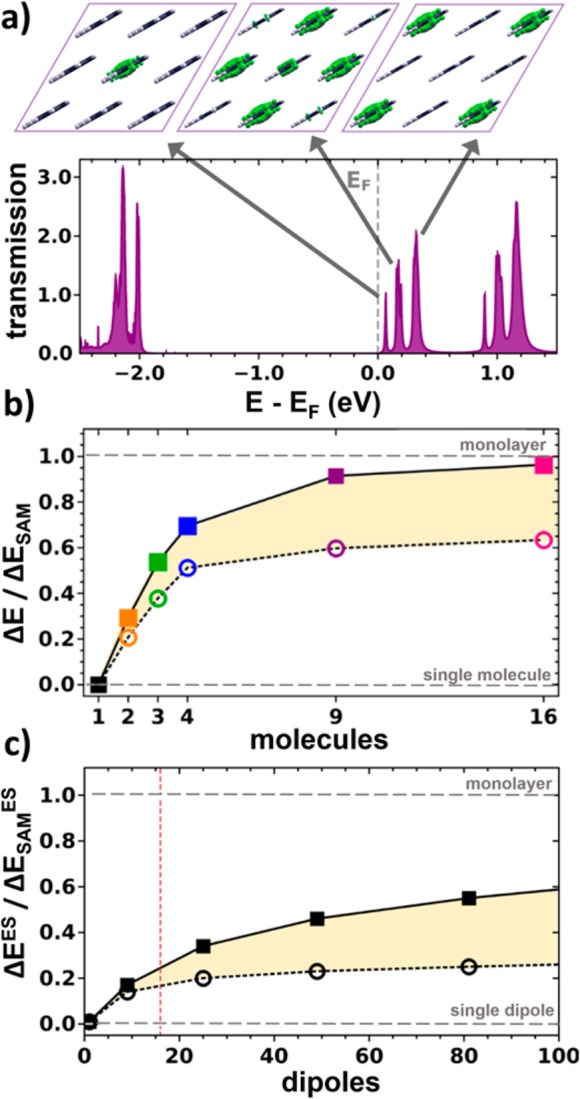
Figure 3.

(a) Transmission function for the pyridine-linked cluster containing nine molecules. The insets show a top view of the local density of states (as obtained from VASP with an isovalue of 0.03 per Å3) associated with the three lowest unoccupied molecular states (calculated for the following energy windows: 0.0–0.1, 0.1–0.25, and 0.25–0.45 eV). (b) Shift between the LUMO-derived transmission peak for the single molecule (SM) limit and for a cluster of size i, ΔEi = ESM – Ei, divided by the equivalent shift between single molecule and monolayer (SAM), ΔESAM = ESM – ESAM. Squares refer to the electrostatically most shifted transmission peak (central molecules), circles to that shifted by the smallest amount (corner molecules). (c) Equivalent energetic shifts calculated from an electrostatic model containing opposing 2D extended sheets of point dipoles; ΔEES corresponds to the difference in electrostatic energy between a pair of isolated opposing dipoles and two extended dipole clusters; ΔESAMES is the electrostatic energy difference between the pair of dipoles and two infinitely extended dipole sheets. The energies are determined in the plane between the dipole sheets; squares refer to positions between the centers of the dipole clusters, circles to positions between corners (see Figure S7). These data represent the electrostatic analogue to the quantum-mechanical results depicted in panel (b) albeit extended to much larger cluster sizes and neglecting the extent of the electronic states perpendicular to the planes of the dipoles. The red vertical line indicates the 16 dipole cluster, which corresponds to the largest cluster calculated also quantum-mechanically. As only relative quantities are reported, this plot is generally valid independent of the magnitude of the dipoles or the distance between the dipole sheets (as long as the latter is larger than the interdipole distance).
