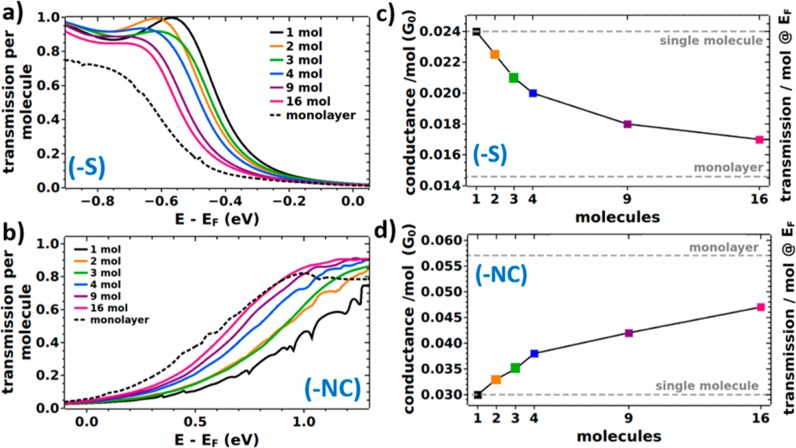
Figure 4.
Calculated energy-dependent zero-bias transmission functions per molecule (a,b) and transmissions per molecule at EF (c,d) for the thiolate (−S) and the isocyanide (−NC) linked molecular junctions depending on the number of molecules in the cluster. Panels c and d also represent the conductance for zero bias. It is obtained via G(EF) = T(EF)·G0, where G0 = 2e2/h refers to the quantum of conductance. For comparison, the two limits of the single molecule and the monolayer junction are indicated (gray dotted lines). Transmission functions plotted over a wider energy range can be found in Figures S9 and S10 in the Supporting Information. These data are provided on a linear and on a logarithmic scale, where the latter is meant to ease the comparison to Figure 2c, and the former allows a comparison with Figure S5. Equivalent plots for the pyridine-docked system can be found in the Supporting Information.

