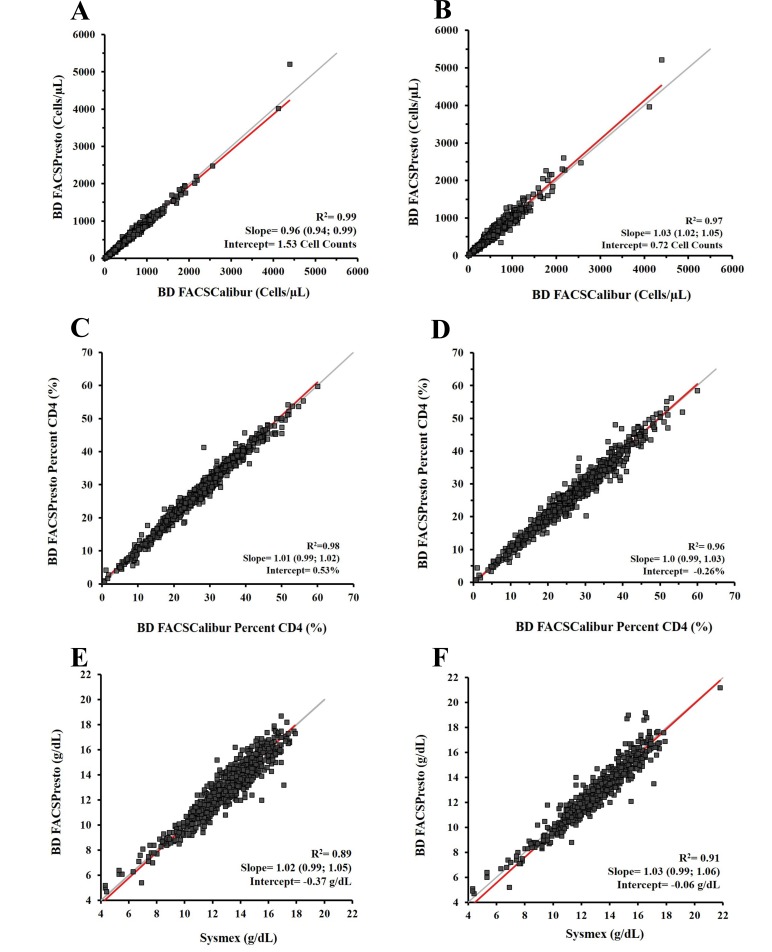
Fig. (3).
Deming regression analysis, Deming regression plots for CD4 cell counts, %CD4 and Hb in venous and capillary blood. BD FACSPresto vs BD FACSCalibur or Sysmex systems.
Deming regression results are depicted for venous blood (3A, 3C, and 3E) and capillary blood (3B, 3D, and 3F). The CD4 count results are shown from weighted Deming regression in 3A and 3B; for %CD4 cells and Hb, the unweighted Deming regression in 3C and 3D and in 3E and 3F respectively. The x-axis displays the predicate method for CD4 cell counts, %CD4 cells, or Hb, and the y-axis corresponds to the BD FACSPresto system. Plots show the R2, slope, and the intercept values for each parameter. The identity regression line is in gray and the calculated regression is in red.

