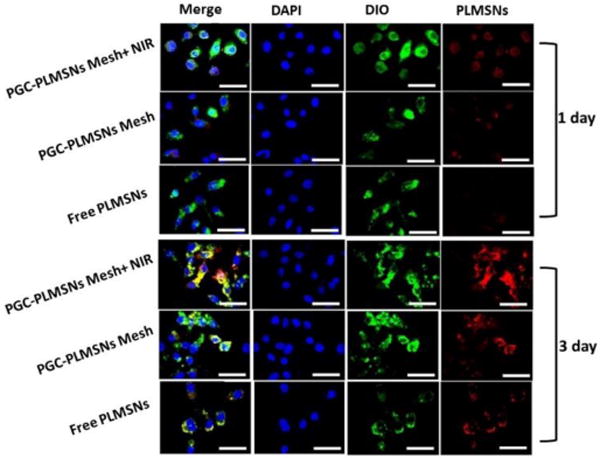
Figure 6.

Laser scanning confocal microscopy (LSCM) images of Hep G2 cells cultured with free PLMSNs, PGC-PLMSNs meshes and PGC-PLMSNs meshes exposed to laser irradiation (NIR 808 nm, 0.6 W/cm2). For each panel, images from left to right show the Hep G2 cell nuclei stained by DAPI (blue), cell membrane stained by DIO (green), and particles fluorescence in cells (red). The scale bar is 50 μm.
