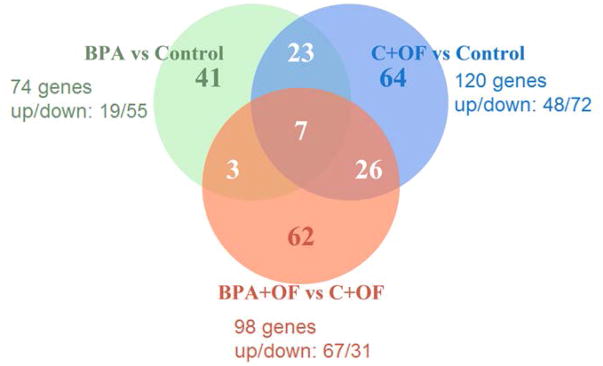
Figure 2.
Comparison of differentially expressed genes (FDR < 0.10 and |FC|≥1.5) between three tests: BPA vs. Control, overfeeding (C + OF) vs. Control and BPA + OF vs. C + OF. Presented are the number of human ortholog IDs for sets of differentially expressed genes and number of up- and downregulated genes for each comparison.

