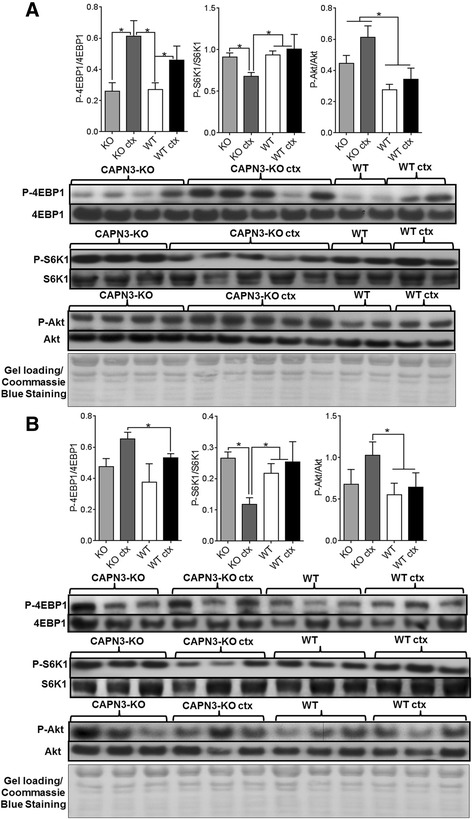
Fig. 5.

Representative western blot images and analysis of Akt/mTOR signaling in CAPN3-KO (KO) and wild type (WT) gastrocnemius muscles. Analysis of P-Akt (Thr308) and mTOR targets, P-4EBP1 (Thr37/46), P-S6 K (Thr389) at 4 weeks (a) and 12 weeks (b) post CTX injection. The results show expression levels of the phosphorylated form of proteins normalized to non-phosphorylated forms. *P < 0.05, two-tailed t test. Error bars represent ± SEM; n = 3–4 in WT and n = 4–5 in KO. Coomassie Blue stained membranes were shown as representative loading controls
