
Fig. 5.
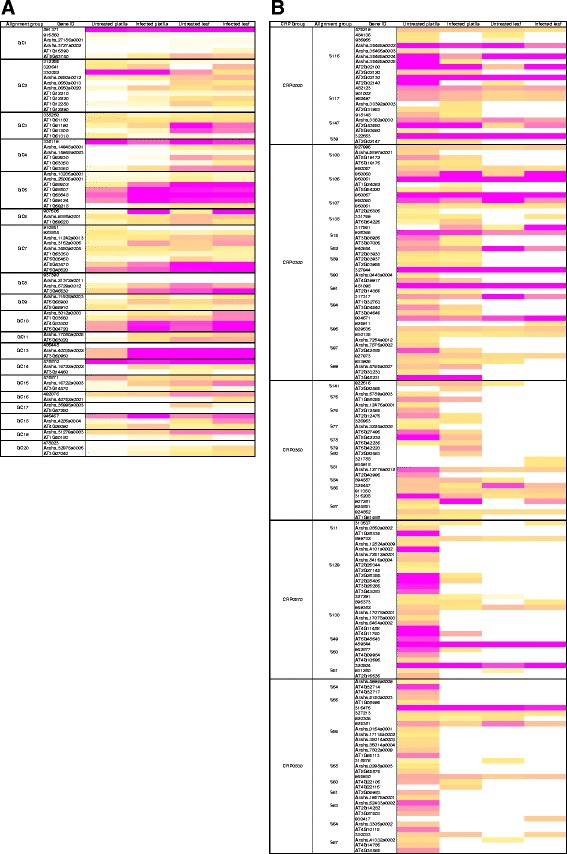
Heat map of CNLs and DEFL gene expression in untreated and Fusarium infected pistils and leaves in Arabidopsis species. a CNLs. b DEFLs. All genes with average expression signals >1 RPKM in at least one condition are shown. Gene expression was scaled based on the distribution of all expression values for each gene family. White color denotes no expression, yellow means expression values in the 50th percentile (intermediate) and magenta denotes expression values in the 90th percentile (high). Due to space limitation, we present here only the largest five CRP groups of DEFL genes. In Additional file 12: Figure S5 all expressed members of this family are shown