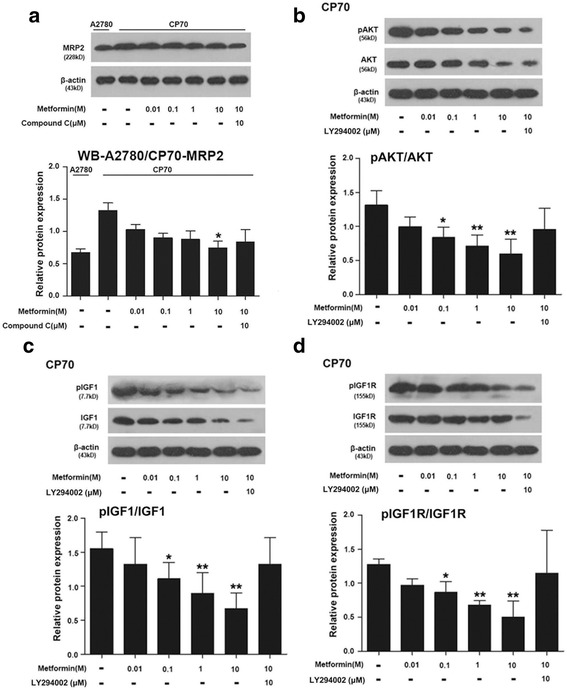
Fig. 3.

Metformin’s effect on MRP2 (a), AKT (b), IGF1 (c), and IGFR1 (d) protein expression in the ovarian cancer cell line CP70. The beta-Actin bands were same in CP70 cells. * shows P < 0.05 between cells untreated with metformin and the treated cells; ** shows P < 0.01 between cells untreated with metformin and the treated cells
