Fig. 3.

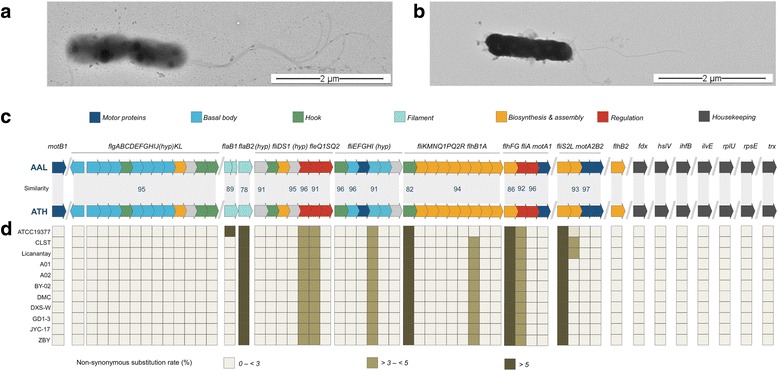
Flagellation patterns in A. albertensis T and A. thioxidans T. a Transmission electron micrograph showing a dividing A. albertensis DSM 14366T cell with tuft of polar flagella and b a cell of A. thiooxidans ATCC 19377T with a single polar flagellum. c Comparison of the flagellar gene cluster between A. albertensis T (AAL) and A. thiooxidans T (ATH) derived from the corresponding genomic sequences. Flagellar genes and gene clusters are indicated accordingly. Percentage of amino-acid similarity is indicated only when bellow 98%. Color coding is as follows: motor proteins (blue), basal-body (turquoise), hook (green), flagellin (light blue), biosynthesis and assembly functions (orange), regulation (red). d Heatmap of the non-synonymous amino acidic substitution rates (percent) of the protein products of each flagellar gene and seven housekeeping genes from A. albertensis T and 11 A. thioxidans T sequenced strains (AFOH01, LGYM01, JMEB01, AZMO01, LWSA01, LWRZ01, LWSB01, LWRY01, LWSC01, LWSD01, LZYI01). Housekeeping genes were chosen after Nuñez et al. [25]
