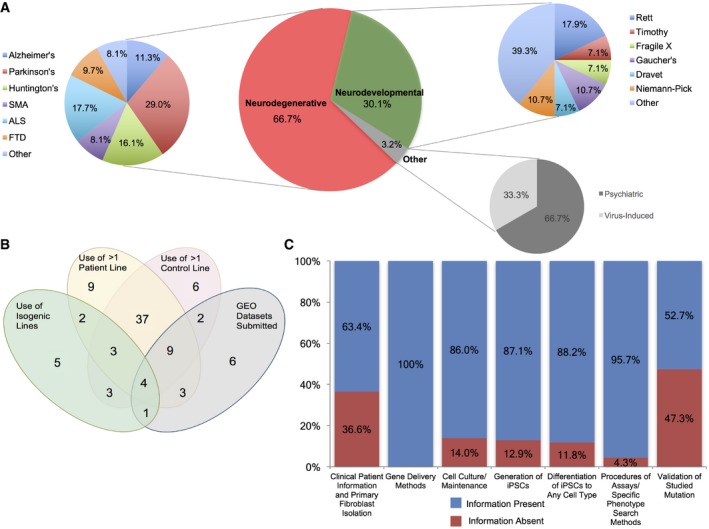
Figure 1. Diversity of methods utilized to model neurological diseases using patient‐derived iPSCs.

- Pie charts illustrating the percentage distribution of disease groups and specific diseases.
- Venn diagram showing unique and shared experimental techniques among the examined articles.
- Minimal information about iPSC experiments (MiPSCE). Percentage of studies with or without the information for each category is depicted by color. Complete descriptions of the categories can be found in Materials and Methods. SMA, spinal muscular atrophy; ALS, amyotrophic lateral sclerosis; FTD, frontotemporal dementia.
