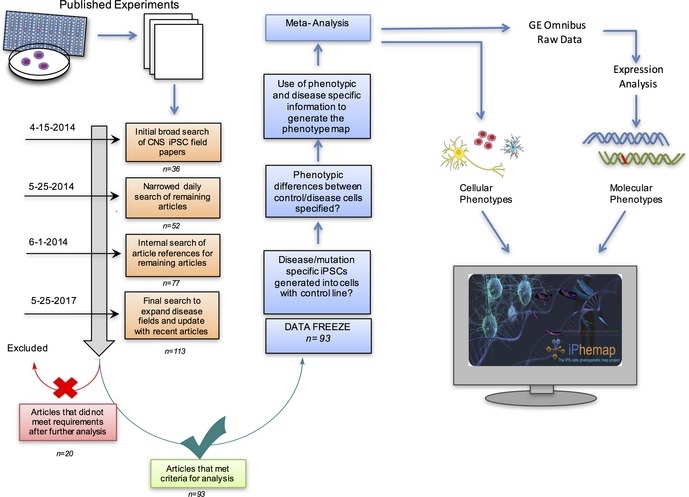
Figure EV1. Diagram of meta‐analysis flowchart showing our search for potential CNS iPSC papers spanned over three years.

Pipeline includes our inclusion and exclusion criteria for selection of candidate papers; 93 of which met these requirements and were examined in our study.
