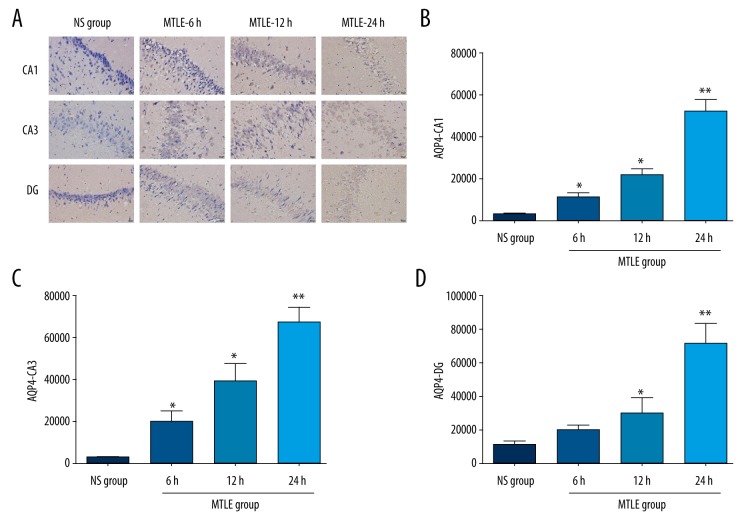
Figure 2.
AQP4 expression examined by using immunohistochemistry assay in MTLE model rats at 6 h, 12 h, and 24 h after the seizure. (A) Immunohistochemistry assay images for AQP4 staining. (B) Statistical analysis for AQP4 staining in CA1 region. (C) Statistical analysis for AQP4 staining in CA3 region. (D) Statistical analysis for AQP4 staining in DG region. * P<0.05 and ** P<0.01 represent the AQP4 staining in MTLE model rats at 6 h, 12 h, and 24 h compared to the NS group.

