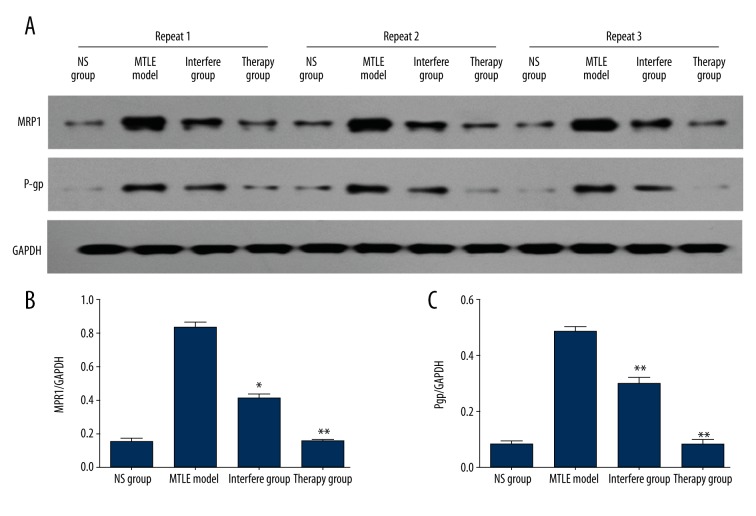
Figure 3.
Multi-drug-resistant protein, MRP1 and Pgp, observation in AQP4 inhibitor-treated MTLE rats. (A) Western blot bands for the MRP1 and Pgp expression in each group. (B) Statistical analysis for MRP1 expression. (C) Statistical analysis for Pgp expression. * P<0.05 and ** P<0.01 represent the MRP1 or Pgp expression in the Interfere group or Therapy group compared to the MTLE rat model.

