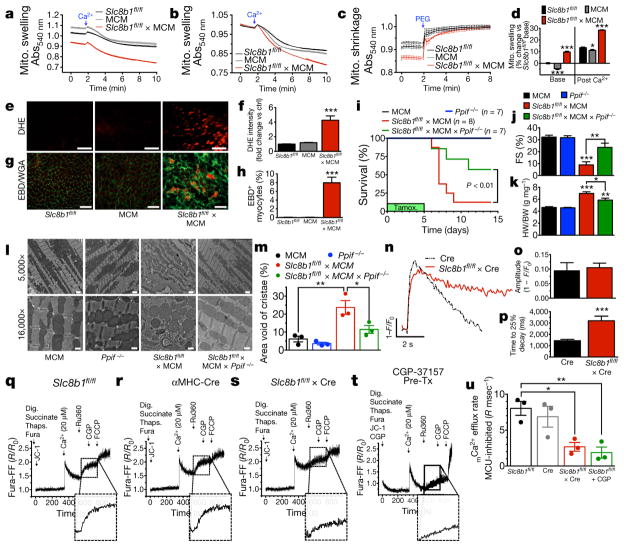
Figure 2. Deletion of Slc8b1 in adult mice ablates mCa2+ efflux resulting in mitochondrial-dependent necrotic cell death.
a, Mitochondrial swelling induced by 500 μM Ca2+ (n = 4 per group). b, Mitochondrial swelling normalized before Ca2+ addition (n =4 per group). c, Mitochondrial shrinkage induced by PEG (n = 4 per group). d, Per cent change in swelling versus control. e, Images of dihydroethidium (DHE) staining in live left ventricular tissue. Scale bars, 40 μm; n =10 Slc8b1fl/fl, n =8 MCM, n =19 Slc8b1fl/fl ×MCM. f, Fold-change in DHE signal versus control. g, Evans blue dye (EBD) and wheat germ agglutinin (WGA) staining in left ventricular tissue 3 days post tamoxifen. Scale bars, 50 μm. h, Per cent EBD+ cardiomyocytes. n = 15 mice per group. i, Kaplan–Meier survival curves of mice during tamoxifen treatment. n =7 Ppif−/−, 10 MCM, 8 Slc8b1fl/fl ×MCM, 8 Slc8b1fl/fl ×MCM ×Ppif−/−. j, Per cent fractional shortening (FS) 3 days post tamoxifen administration. n = 5–6 mice per group. k, Heart weight to body weight ratio 3 days post tamoxifen treatment. n = 5 mice per group. l, Electron microscopy images of left ventricular tissue 3 days after tamoxifen treatment, imaged at 5,000× magnification (scale bars, 1 μm) and 16,000× magnification (scale bars, 500 nm). m, Mitochondrial cristae density, represented as per cent area void of cristae. n = 3–4 mice per group. n, Mitycam mCa2+ transients of ACMs paced at 0.1 Hz. F/F0 indicates the maximum fluorescence of the cell over the average fluorescence before stimulation. o, mCa2+ peak amplitude. p, mCa2+ time to 25% decay. n =7 Cre, n =14 Slc8b1fl/fl ×Cre ACMs. q–s, mCa2+ uptake and efflux in isolated, permeabilized ACMs. dig., digitonin; thaps., thapsigargin; Ru360, MCU inhibitor; CGP, NCLX inhibitor. Inset, magnified smoothed efflux tracing. R indicates the ratio of the ratiometric reporter Fura-FF (340/380 nm excitation and 510 nm emission). R/R0 indicates the ratio at each time point over the ratio at time 0. t, Wild-type ACMs pre-treated with NCLX inhibitor. u, mCa2+ efflux rate. n = 3 replicates per group; *P <0.05, **P <0.01, ***P <0.001.

