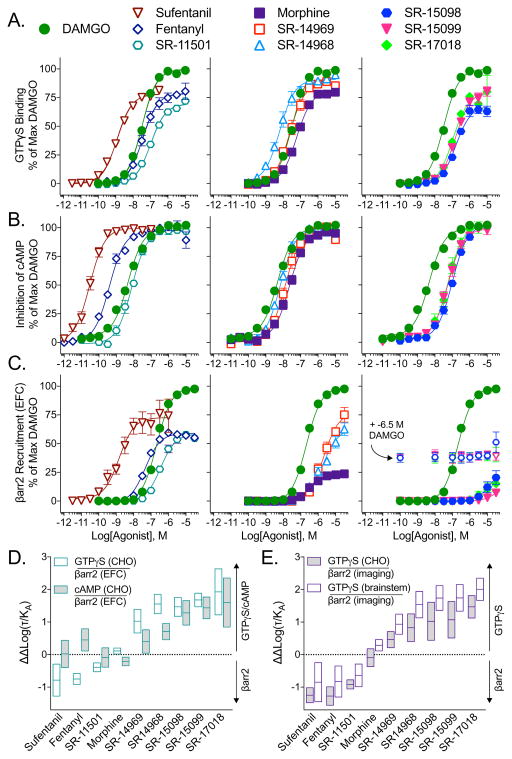
Figure 1. SR compounds are potent activators of GTPγS binding, but have differential βarrestin2 signaling profiles at the human MOR.
(A–C) Cell-based assays assessing (A) stimulation of GTPγS binding in membranes and (B) inhibition of forskolin-stimulated cAMP accumulation in CHO-hMOR cells and (C) stimulation of βarrestin2 recruitment in the U2OS-βarrestin-hMOR-PathHunter via the EFC assay. For SR-15098, SR-15099 and SR-17018, βarrestin2 EFC concentration response curves were also performed in the presence of e-6.5 M DAMGO (open symbols) to test for partial agonism. For all three assays, the data were normalized to the % maximal response for DAMGO and are presented as mean ± S.E.M. of 3 or more assays run in duplicate or triplicate.
(D–E) The ΔΔLog(τ/KA) bias values with 95% confidence intervals with for the (D) human MOR and (E) mouse MOR. The G protein signaling was determined by either the GTPγS binding assay in CHO-hMOR or CHO-mMOR cells or mouse brainstem or by inhibition of forskolin-stimulated cAMP in CHO-hMOR cells. βarrestin2 recruitment to the MOR was determined by the EFC assay in U2OS-βarrestin-hMOR-PathHunter cells for the human receptor and by the βarrestin2 imaging based assay using the U2OS-βarrestin2-GFP-mMOR cell line for the mouse receptor. In all assays, DAMGO served as the reference agonist.
See also: Table 2 for the Log(τ/KA) and ΔΔLog(τ/KA) values with statistical comparison and Figure S3 for the concentration response curves for the mouse MOR assays (cells and brainstem).

