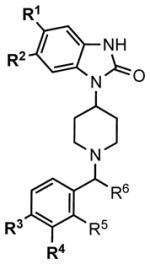
Table 1. Structural features influencing GTPγS binding and βarrestin2 recruitment.
Potency (EC50) and efficacy (EMAX, percent of DAMGO) values from GTPγS binding assays performed on CHO-hMOR membranes and βarrestin2 recruitment determined by EFC βarrestin2 assay with the U2OS-βarrestin2-hMOR-PathHunter cells. Data are presented as mean ± S.E.M. of 3 or more assays run in duplicate or triplicate. See also: Figure S1 for chemical synthesis; Figure S2 for counter-screens against other opioid receptors; and Table S1 for binding affinities for the compounds below the dotted line.
|
|
||||||||||
|---|---|---|---|---|---|---|---|---|---|---|
| Agonist | Entry | Substituentsa | GTPγS binding | βarrestin2 recruitment | ||||||
|
|
|
|
||||||||
| R1 | R2 | R3 | R4 | EC50 nM | EMAX % | EC50 nM | EMAX % | |||
|
| ||||||||||

|
DAMGO | 33 ± 1.4 | 100 | 229 ± 12 | 100 | |||||
| Morphine | 64 ± 4.2 | 81 ± 1 | 372 ± 20 | 24 ± 1 | ||||||
| Sufentanil | 1.3 ± 0.18 | 78 ± 1 | 1.5±0.6 | 73±11 | ||||||
| Fentanyl | 43 ± 9.7 | 80 ± 5 | 53 ± 6.8 | 60 ± 2 | ||||||
|
| ||||||||||
| (±) SR-8595 | 1 | H | H | H | Me | 102 ± 10 | 89 ± 7 | 447 ± 52 | 67 ± 3.8 | |
| (±) SR-11065 | 2 | H | H | Cl | Me | 16 ± 1.2 | 97 ± 7 | 253 ± 88 | 76 ± 8.8 | |
| SR-20382 | 3 | H | H | Cl | H | 563 ± 104 | 62 ± 4 | 7656 ± 1469 | 67 ± 9.8 | |
| SR-20437 | 4 | Cl | Cl | H | H | 171 ± 24 | 60 ± 5 | 1092 ± 273 | 24 ± 3.6 | |
|
| ||||||||||
| SR-17018 | 5 | Cl | Cl | Cl | H | 97 ± 13 | 75 ± 4 | >10,000 | 10 ± 6c | |
| SR-15099 | 6 | Cl | Cl | Br | H | 155 ± 11 | 81 ± 4 | >10,000 | 3 ± 1c | |
| (±) SR-14968 | 7 | Cl | Cl | Br | Me | 8.9 ± 3.8 | 92 ± 1 | 2438 ± 710 | 64 ± 5 | |
| (±) SR-14969a | 8 | Cl | Cl | Cl | Me | 28 ± 7.7 | 88 ± 2 | 2949 ± 789 | 81 ± 6 | |
| SR-15098a | 9 | Cl | Cl | Cl | H | 179 ± 24 | 68 ± 4 | >10,000 | 12 ± 5c | |
| (±) SR-11501 | 10 | H | H | b | Me | 106 ± 9.1 | 70 ± 1 | 374 ± 60 | 59 ± 2 | |
|
| ||||||||||
R5 = F;
(R3 + R4) = (-OCH2CH2O-); for all other compounds, R4 = R5 = H;
percent of maximum stimulation at the 10 μM concentration is presented rather than EMAX.
