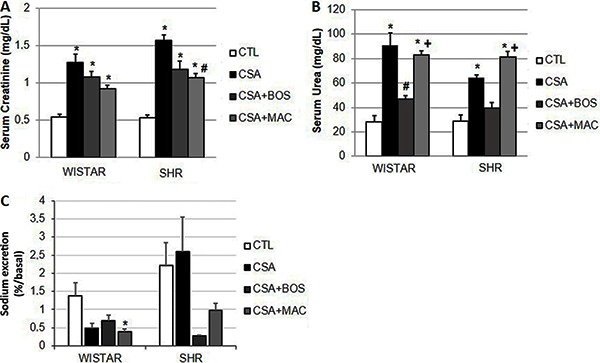
Figure 3. Quantitative analyses of A, plasmatic creatinine, B, plasmatic urea, and C, sodium excretions in Wistar (normotensive) and genetically hypertensive (SHR) rats in the control group (CTL), receiving cyclosporine-A (CsA) or receiving CsA and treated with bosentan (CsA+BOS) or macitentan (CsA+MAC) for 15 days. Data are reported as means±SE. The significance level for a null hypothesis was set at 5% (P<0.05). *P<0.05, compared to the CTL group; #P<0.05, compared to the CsA group. +P<0.05, compared to the CsA+BOS group (ANOVA followed by the Tukey test or Student's t-test).

