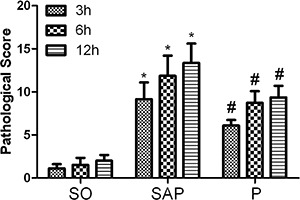
Figure 3. Analysis of pathological scores for pancreatic tissues at 3, 6, and 12 h. Data are reported as means±SD.*P<0.05 compared with the sham operation (SO) group; #P<0.05 compared with the severe acute pancreatitis (SAP) group (ANOVA). P: pioglitazone group.

