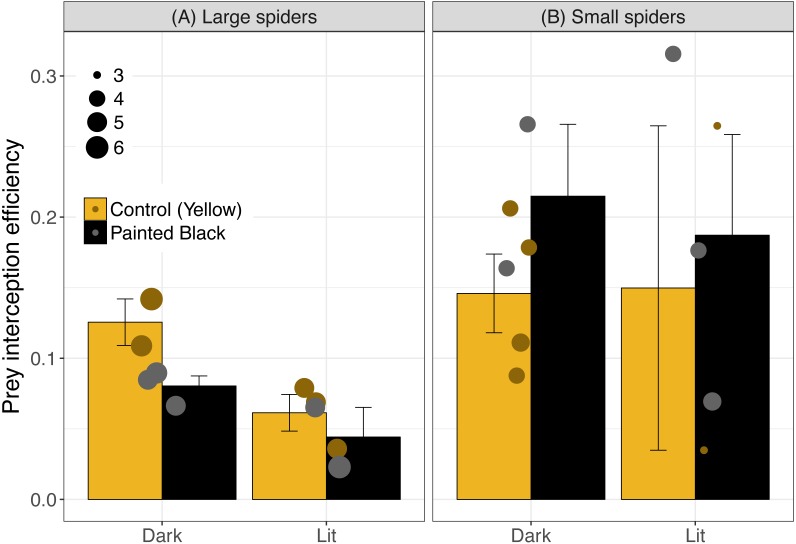
Figure 4. Interception efficiency across color and light treatments.
Error bars indicate mean ± standard error. Spider size was broken down into categorical variable for visualization, where spiders above 4.5 cm were identified as large (A) and were otherwise identified as small (B). Data points are scaled to spider size (in cm).

