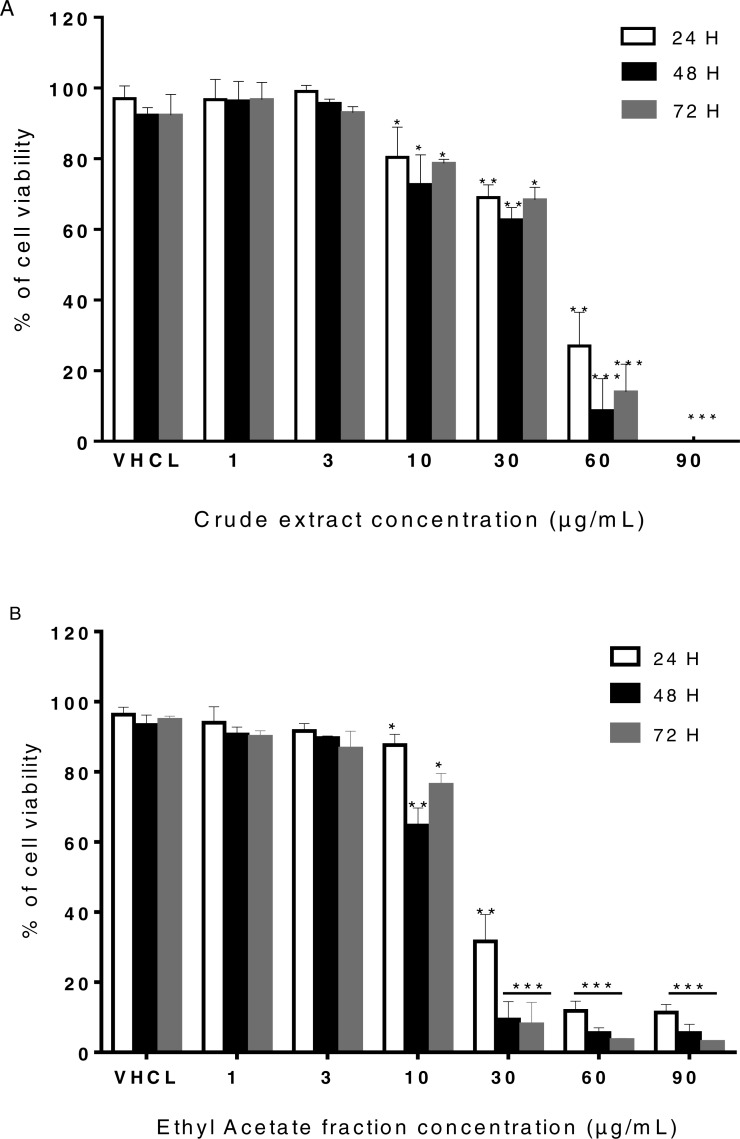
Figure 2. Cell viability of LHCN-M2 cells.
(A) Cells were cultivated in the presence of CE (1, 3, 10, 30, 60 and 90 µg/mL) for 24, 48 and 72 h. (B) Cells were cultivated in the presence of EtOAc (1, 3, 10, 30, 60 and 90 µg/mL) for 24, 48 and 72 h. The results were expressed as a percentage of treated cells normalized to untreated control cells. Vehicle (VHCL) treated cells were used as the negative control. Mean values (% of control) with S.D. are indicated. This experiment was performed in duplicates and repeated three times. The significance (∗p ≤ 0.05, ∗∗p ≤ 0.01, ∗∗∗p < 0.001) of cell viability in treated cells with respect to the untreated cells (CTRL).

