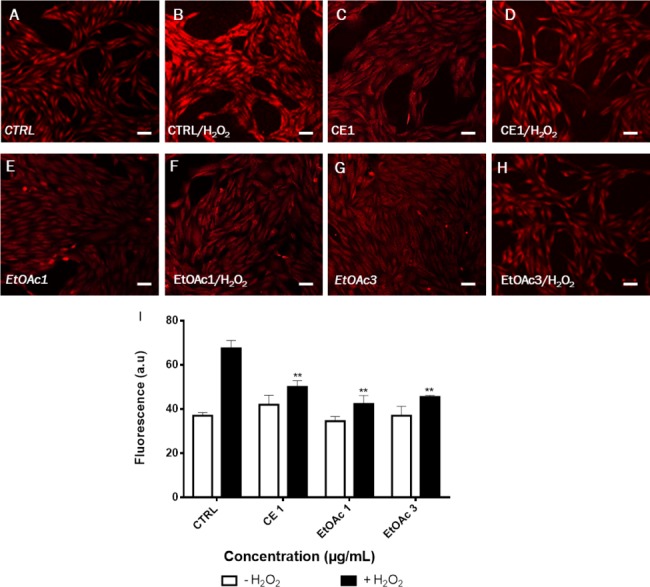
Figure 4. Assessment of ROS production in LHCN-M2 cells after pre-treated with sumac extracts and stimulated with 75 μM H2O2.

(A–H), Representative DHE fluorescence staining of the oxidative stress. (I), Fluorescence was calculated and plotted on the graph for different concentrations of CE and EtOAc fractions of sumac using the ImageJ software. The significance (∗∗p ≤ 0.01) of fluorescence in treated cells/+H2O2 with respect to the untreated cells/−H2O2. Scale bar 20 μm.
