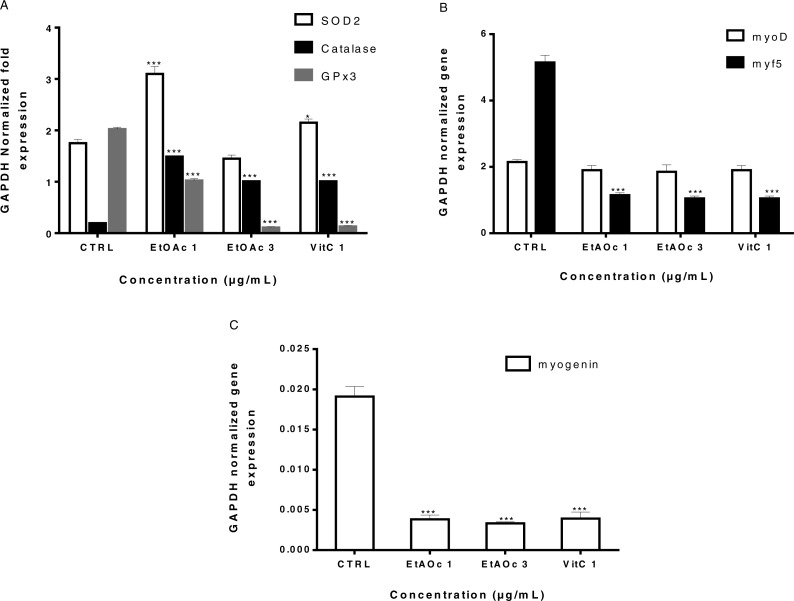
Figure 6. Expression of antioxidant genes GPx3, SOD, catalase and muscle determination and differentiation genes myoD, myf5 and myogenin in LHCN-M2 cells.
The levels of Gpx3–SOD2 Catalase (A), myoD-myf5 (B) and myogenin (C). mRNA were analyzed using RT-qPCR 48 h after treatment with EtOAc fraction and VitC (A, B, C). Expression of GAPDH was used as an internal control to normalize the target gene levels. Experiments were performed twice. The significance (∗p ≤ 0.05, ∗∗p ≤ 0.01 & ∗∗∗p < 0.001) of gene expression in treated cells with respect to the untreated cells (CTRL).

