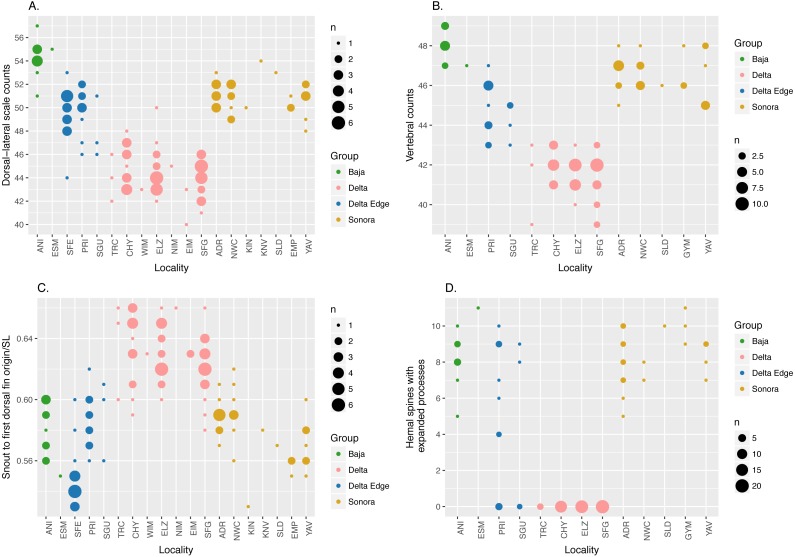
Figure 2. Dot plots of morphological data.
Dot plots showing external (A and C) and vertebral (B and D) morphological data; size of dots is proportional to the number of specimens (n). “Delta Edge” is the hypothesized hybrid zone; “Delta” is the territory for C. hubbsi; “Baja” and “Sonora” are the territories for C. regis. Refer to Tables 1 and 2 for location codes of modern and historical specimens, respectively. Six specimens from NWC and three specimens from YAV were excluded from the hemal spine data set (D) as these specimens were too small to reliably identify the presence/absence of the expanded process on the hemal spines (See Fig. S1).

