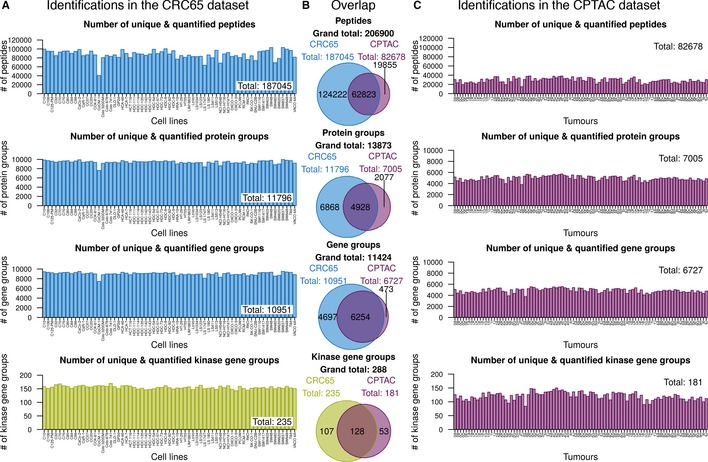
Figure 2. LC‐MS/MS‐based identifications.

- Bar charts visualising the number of unique identified and quantified peptides, protein groups and gene groups (full proteomes), as well as kinase gene groups (Kinobeads), across the CRC65 cell line panel (n = 65 cell lines). Insets indicate the corresponding number of identifications across the entire dataset.
- Venn diagrams showing the intersection and complements with respect to identifications in the aforementioned categories across both the CRC65 cell line and CPTAC patient dataset (n = 89 tumours). Kinase identifications in the CPTAC dataset were extracted from the full proteome data.
- Same as (A) for the CPTAC dataset. The different proteomic datasets were colour‐coded (green = Kinobeads, blue = CRC65 full proteomes and purple = CPTAC full proteomes).
