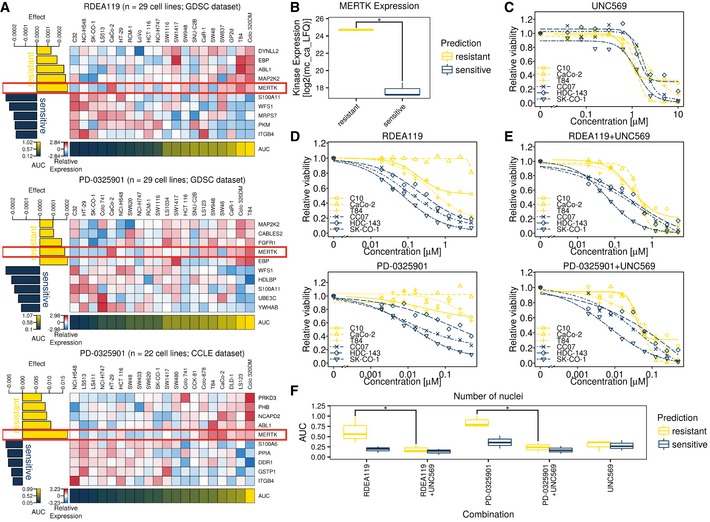
Figure EV6. Co‐treatment with UNC569 (MERTK inhibitor) and MEK inhibitors is more effective than treatment with MEK inhibitors alone (related to Fig 5).

-
AEffect‐size heat maps of two drugs (one from two datasets) targeting MEK1/2 show consistent association of high MERTK expression with drug resistance, even when drug sensitivity is modelled based on all proteins in the Kinobeads expression matrix (see Appendix Supplementary Methods).
-
BBoxplots of MERTK expression (log2‐transformed and median‐centred LFQ values after ComBat adjustment) in cell lines predicted to be sensitive (CC07, HDC‐143, SK‐CO‐1; dark blue) or resistant (C10, CaCo‐2, T84; yellow) towards two MEK1/2 inhibitors RDEA119 and PD‐0325901. The whiskers extend to the minimum and maximum expression of MERTK for cell lines with a given sensitivity prediction, while the median expression of MERTK is marked with a bold horizontal line inside a box spanning the interquartile range (IQR) from the 25% quantile (lower horizontal line) to the 75% quantile (upper horizontal line). Resistant cell lines show significantly higher expression of MERTK than sensitive ones (P ≤ 0.05, one‐sided Mann–Whitney test).
-
C–E10‐point dose–response curves of (C) the MERTK inhibitor UNC569, (D) two MEK1/2 inhibitors RDEA119 and PD‐0325901 and (E) their constant‐ratio combination (see Appendix Supplementary Methods) for the same cell lines as in (B) from our own in vitro experiments. Relative response is expressed as the mean of three technical replicates.
-
FBoxplots of the AUC from (C–E), showing significant differences between cell lines predicted to be sensitive (CC07, HDC‐143, SK‐CO‐1; dark blue) and cell lines predicted to be resistant (C10, CaCo‐2, T84; yellow) to RDEA119 and PD‐0325901 (P ≤ 0.05, one‐sided Mann–Whitney test). The whiskers extend to the minimum and maximum AUC for a given drug and sensitivity prediction, while the median AUC is marked with a bold horizontal line inside a box spanning the interquartile range (IQR) from the 25% quantile (lower horizontal line) to the 75% quantile (upper horizontal line). This difference disappears when co‐treating cells with UNC569 in addition to MEK1/2 inhibitors.
